As a Product Manager, you're paid to make high-stakes decisions, often with incomplete information. Regression analysis is the tool that elevates you from relying on gut feelings to making data-backed strategic calls that get you promoted. Forget the dense statistical theory. This guide provides a step-by-step framework to turn raw user data into answers for critical product questions like, "Which specific user actions have the biggest impact on our Q3 revenue goals?" or "How much does our new onboarding flow actually increase 30-day retention?"
This isn't an academic exercise; it's a practical workflow you can implement immediately to drive business outcomes and demonstrate your value as a data-driven leader.
A PM's Framework for Data-Driven Decisions
Your job isn't to be a data scientist, but to leverage data to build better products and advance your career. At companies like Meta and Google, the most effective PMs I've worked with don't just consume dashboards; they own the entire analytical process from question to action. Let's start with the actionable framework they use.
The journey from a vague business problem to a clear strategic recommendation boils down to a repeatable workflow.
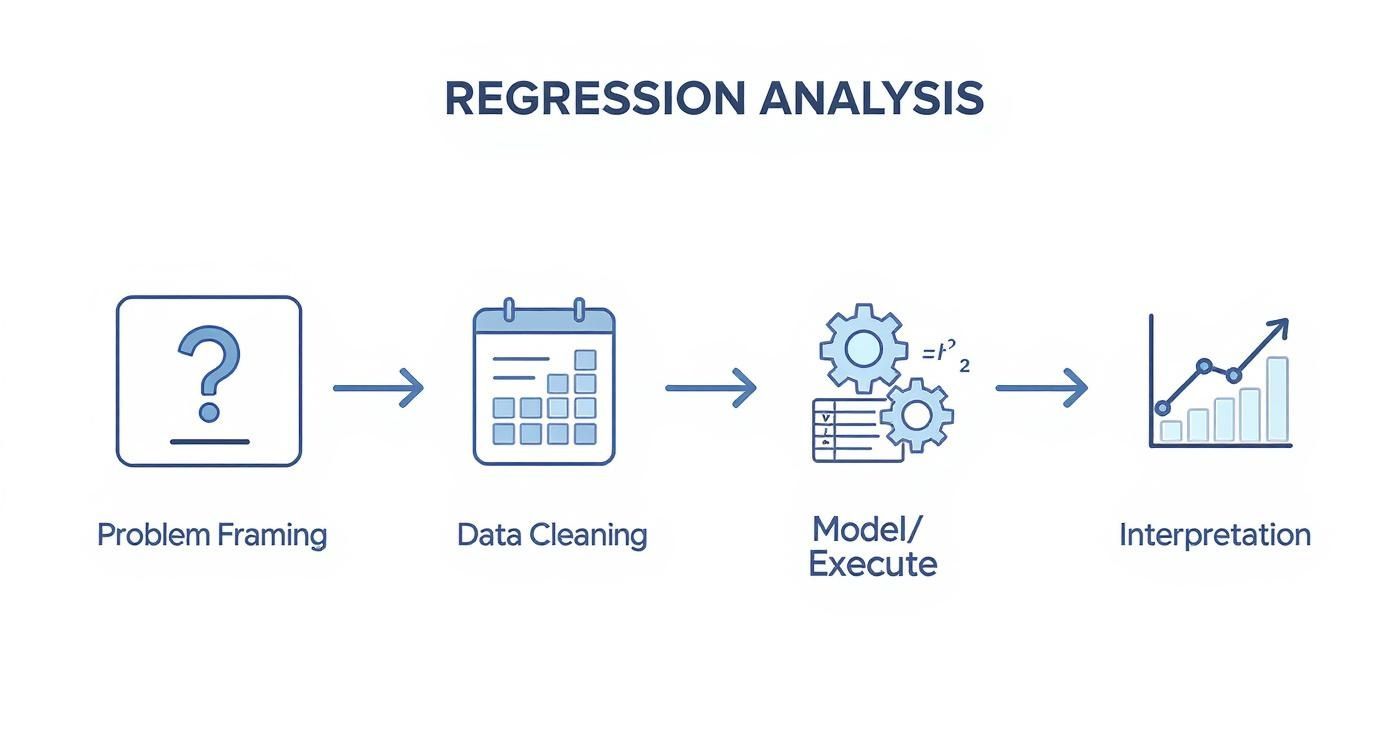
This workflow shows that the real analysis begins long before you open a spreadsheet and ends with strategic action, not a pile of statistical jargon. This is how you connect data work to business impact.
The 5-Stage Regression Analysis Workflow for Product Managers
For PMs, regression isn't just about finding correlations; it's a structured process for uncovering the 'why' behind user behavior and business outcomes. This table breaks down the entire workflow into five manageable stages, showing how you move from a high-level question to an actionable insight you can present to leadership.
| Stage | Key Objective | Example PM Question (Netflix) |
|---|---|---|
| 1. Problem Framing | Define a specific, measurable, and answerable business question. | "Does a user adding 5+ titles to their 'My List' in the first week increase their 90-day retention?" |
| 2. Data Collection & Prep | Gather, clean, and structure the necessary data for analysis. | Pull user activity logs from the data warehouse, clean for duplicates/bot activity, handle nulls for retention data, and create a binary variable for my_list_adoption. |
| 3. Model Selection | Choose the right type of regression model based on the question. | Since the outcome (retained vs. not retained) is binary, a Logistic Regression model is the appropriate choice. |
| 4. Model Execution & Evaluation | Run the model and check its statistical validity and performance. | Execute the logistic regression in Python, then check the model's p-values for significance, coefficients for impact, and overall model fit (AUC). |
| 5. Interpretation & Action | Translate statistical output into a business narrative and a strategic plan. | The model shows a significant positive coefficient. Translate this to: "Yes, early adoption of 'My List' strongly predicts higher retention. We should A/B test a new onboarding step that encourages this behavior." |
Each stage builds on the last. A poorly framed question leads to a useless model, and a brilliant model without clear interpretation gathers digital dust. As a PM, your value is in owning the entire process, especially the first and last stages—the strategic bookends.
The process of running a regression is now accessible through tools like Excel, R, or Python. Your first real task is getting your hands dirty with data preparation—cleaning it up and making sure it meets the core assumptions, like linearity, which are essential for getting trustworthy results.
Picking the right model is your next critical decision. A simple linear regression is your go-to when you have just one independent variable, but you'll need a multiple regression model when you're juggling several.
Ultimately, the goal isn't just to run a model; it's to make better, faster decisions. Here’s how those stages look in practice:
-
Problem Framing: Start with a laser-focused product question. Don’t ask, “Is our new feature working?” Ask, “Does completing the new onboarding flow increase a user's 30-day retention rate by a statistically significant amount?” Specificity is everything. This is what separates junior PMs from senior leaders.
-
Data Preparation: This is where at least 80% of analyses live or die. It’s the unglamorous but essential work of cleaning your dataset, figuring out how to handle missing values, and getting all your variables into a format the model can actually use.
-
Model Selection & Execution: Choose the right tool for the job. Is your goal to predict a number, like customer lifetime value? Use linear regression. Are you trying to predict a yes/no outcome, like churn? That's a job for logistic regression.
-
Interpretation & Action: This is where you, the PM, truly shine. You must translate the model's output—things like coefficients and p-values—into a compelling business story and a concrete recommendation. This is the heart of true data-driven decision-making for PMs.
Turning Messy Data Into Strategic Insights
A powerful model built on flawed data is useless. This is where most PM-led data projects go off the rails, but it’s also where you lay the foundation for credible, strategic results that get you noticed.
Before we touch the stats, the real work begins: turning raw, messy user data into a clean, structured dataset. This isn't just about deleting bad rows; it’s about making deliberate choices that directly shape your model's output and the final story your data tells.

From Raw Data to a Predictive Asset
First, you have to tackle the inevitable mess in your dataset. How you handle these imperfections is a critical first step.
-
Handling Missing Values: A classic PM dilemma. A user record is missing their acquisition channel. Do you delete the record? Or impute a value, like the most common channel ('organic search')? Removing too many records can shrink your dataset and introduce bias, but a bad imputation can skew your results. For a critical analysis, I always advise my teams to document these decisions in a shared doc to defend their methodology later.
-
Feature Engineering: Here’s where your product sense creates a massive competitive advantage. Feature engineering is creating new, more powerful predictor variables. For instance, a PM I coached at a B2B SaaS company turned a simple
last_login_datetimestamp into a much more predictive feature calleddays_since_active. Suddenly, this new variable had a much stronger correlation with user churn.
As a PM, your ability to translate business context into engineered features is a massive advantage. You understand the user journey better than anyone, allowing you to create variables that a pure data scientist might overlook. This is how you add unique value.
This transformation often separates a generic analysis from one that uncovers a genuine competitive edge. But be warned: this process can shine a harsh light on deep-seated data quality issues. It's worth understanding the common complaints data stakeholders have to navigate these conversations effectively.
Checking Key Regression Assumptions
Before you can trust your model, you need to ensure your data plays by the rules of linear regression. You don't need a Ph.D. in statistics, but you must be able to spot obvious red flags.
The two most important assumptions you can check visually are:
-
Linearity: The relationship between your independent and dependent variables should look roughly like a straight line, not a curve. If you’re plotting ad spend against new signups, you'd hope to see signups increase in a relatively straight-line pattern as spend goes up.
-
Homoscedasticity: Don't let the word intimidate you. It means the spread of your data points should be consistent. On a scatter plot, you want a random cloud of dots, not a cone or fan shape where the points spread out as the variable increases.
A few quick scatter plots will tell you if you're on the right track.
Imagine the product team at Peloton analyzing the relationship between the number of classes taken per month (independent variable) and subscription renewal rates (dependent variable). If their data showed a clear, straight-line trend with consistent variance, they could confidently move forward with their model. This meticulous prep is the non-negotiable first step to getting insights you can actually bet your career on.
Choosing the Right Model and Tools
Your product question should dictate the model, not the other way around. As a Product Manager, you don't need to be a Python expert, but you absolutely have to know which tool to use for which job. This is a core competency that hiring managers at top tech companies look for. Getting this choice right separates a clear, predictive signal from statistical noise.
The decision boils down to what you're trying to predict. Are you forecasting a continuous number, like next quarter's revenue? Or predicting a binary choice—like 'churn vs. retain'?

Mapping Your Question to the Right Model
Your entire analysis kicks off by framing your business problem as a specific type of prediction.
-
Linear Regression (Simple & Multiple): Use this when your dependent variable—the thing you want to predict—is a continuous number. A classic PM use case is forecasting customer lifetime value (LTV). You might start with a simple linear regression using one predictor, like
time_in_app, or a multiple linear regression that includestime_in_app,number_of_features_used, andsupport_tickets_created. -
Logistic Regression: This is your go-to for binary outcomes. When the question is "yes or no," logistic regression is the answer. For instance, a PM at a B2B SaaS company like Slack could use it to predict which trial users are likely to convert to a paid plan based on their team size and number of messages sent in the first week.
As a PM, your primary role isn't to build the model but to define the problem so crisply that the choice between linear and logistic regression becomes obvious. Your clarity at this stage saves your data team weeks of wasted effort.
Selecting Your Analysis Toolkit
Once you know the what (your model), you need the how (your tool). The right choice depends on your technical comfort level and the complexity of your question.
Statistical regression is now so accessible that it's built into software like Microsoft Excel, which, holds a market share of over 75% among business analysts. This makes a quick, basic analysis incredibly easy to get started with.
To help you decide, here's a guide to map the right regression model and tool to your specific situation as a PM.
Regression Model and Tool Selection for PMs
| Regression Type | When to Use It (PM Scenario) | Recommended Tool | Skill Level & Career Stage |
|---|---|---|---|
| Simple Linear | Predicting a metric from one variable (e.g., forecasting LTV from initial purchase value). | Excel / Google Sheets | Beginner (Aspiring/Entry-Level PM) |
| Multiple Linear | Forecasting a metric using several factors (e.g., predicting user engagement from app usage, feature adoption, and demographics). | Tableau / Python (statsmodels) |
Intermediate (Mid-Career PM) |
| Logistic | Predicting a "yes/no" outcome (e.g., identifying users at high risk of churning based on their activity). | Python (statsmodels) / R |
Advanced (Senior/Lead PM) |
As you advance in your career, your ability to handle more complex analyses grows. Aspiring PMs can demonstrate value with Excel, but Senior PMs at companies like Amazon are expected to collaborate effectively with data scientists, which often requires a baseline understanding of tools like Python.
Here’s a simple Python example using the statsmodels library for a linear regression. You could share this with an engineer to kick off a discussion:
import statsmodels.api as sm

# Y is your dependent variable (e.g., LTV)
# X contains your independent variables (e.g., time_in_app)
X = sm.add_constant(X) # Adds an intercept to the model
model = sm.OLS(Y, X).fit()
print(model.summary())
Knowing these fundamentals empowers you to ask better questions and work more effectively with your technical counterparts. If you're ready to explore even more powerful methods, check out our guide to the top AI tools for Product Managers to see what's possible.
Running a regression in Python or Excel is the easy part—seriously, it's often just a few clicks or a couple of lines of code. The real work, the part that separates a good PM from a great one, is translating that dense statistical output into a compelling story that actually drives action.
This is how you level up from just consuming data to becoming a truly data-driven strategist.
Your model is going to spit out a summary table that's just brimming with numbers. Don't let it intimidate you. Your job is to zero in on the few key metrics that tell the most important parts of the story.
Decoding the Key Metrics for PMs
As a PM, you really only need to get comfortable with three core components to hold your own in any data discussion and make solid recommendations.
-
Coefficients (The "What"): This is your most actionable number. The coefficient tells you the size and direction of a variable's impact. Say you're predicting user lifetime value (LTV), and a variable like
completed_onboarding_flowhas a coefficient of +120. That means, all else being equal, users who finish the onboarding flow are associated with $120 more in LTV. This gives you an immediate, quantifiable reason to go fix that onboarding experience. -
P-values (The "If"): The p-value tells you if what you're seeing is real or just random noise. The standard threshold is usually p < 0.05. If the p-value for your
completed_onboarding_flowis 0.01, you can be confident that the +$120 effect is legit and not a fluke. If it’s 0.50, that relationship is probably just random chance, and you shouldn't bet your roadmap on it. -
R-squared (The "How Much"): R-squared tells you what percentage of the change in your target variable is actually explained by your model. So if your R-squared is 0.65, it means your model explains 65% of the variation in LTV. But here's a pro-tip: in the messy world of user behavior, a "good" R-squared might be as low as 0.20 or 0.30. Don't chase a perfect score. Your focus should be on finding significant drivers (low p-values) with meaningful effects (strong coefficients).
For a real-world application of regression in finance, check out understanding how financial metrics like Beta are derived. It’s a great example of using this kind of analysis to assess risk for major strategic decisions.
From Numbers to Narrative
Once you've got a handle on the key metrics, your final and most critical task is communication. You have to frame your findings for stakeholders—from engineers to the C-suite—in a way that cuts through the statistical jargon and connects directly to business goals.
Your summary needs to be a clear, concise story that answers three questions: What did we look into? What did we find? And what should we do now?
Actionable Executive Summary Template:
"We analyzed what drives user LTV and found that completing our onboarding flow is the single biggest predictor, associated with a $120 increase in value per user. This finding is statistically significant (p < 0.01).
Recommendation: I recommend we dedicate the next sprint to an A/B test aimed at increasing onboarding completion by 10%. Based on our model, this could drive an estimated $500k in incremental annual revenue."
This translation is where you provide ultimate value. It transforms a complex analysis into a clear, data-backed proposal that executives can understand and act on, directly shaping the future of your product and marking you as a leader.
Avoiding Common Regression Analysis Pitfalls
Having hired and mentored dozens of PMs at various levels, I’ve seen the same analytical mistakes completely derail promising product initiatives. A powerful model is useless if it’s built on a shaky foundation. Here's how to spot and sidestep the most common traps.
https://www.youtube.com/embed/mlqNpzyVcto
The term 'regression' was coined by Francis Galton when he noticed the heights of children tended to "regress" toward the average height. What started as an observation about genetics evolved into the powerful statistical tool we use today. Modern computers have made it almost too easy to run a regression. It's simple to get a result, but just as simple to get a misleading one.
The Danger of Overfitting
Overfitting is the cardinal sin of predictive modeling. I can't stress this enough. It happens when your model learns the training data too well, capturing random noise instead of the actual underlying trend. The result? A model that looks like a genius on past data but completely falls apart when predicting the future.
Imagine a PM at DoorDash builds a model that perfectly explains last quarter's delivery times using ten different variables. It looks amazing. But when they use it to forecast next quarter, the predictions are all over the place. That's classic overfitting.
PM Pro Tip: Always test your model on a "holdout" dataset—a chunk of data it has never seen before. If its performance drops off a cliff, you have an overfitting problem. The fix is usually to simplify your model by removing the less important variables.
The Multicollinearity Trap
Multicollinearity means your independent variables are highly correlated with each other. When this happens, the model gets confused and can't figure out which variable is actually responsible for the effect you're seeing.
Let's say a marketing PM is trying to predict new signups using both Google Ads spend and Facebook Ads spend. If both budgets always go up or down together, the model can't isolate the true impact of each channel. It might assign a massive coefficient to Google and almost nothing to Facebook, making your results unreliable.
To get your models right, it's crucial to validate their effectiveness. This often involves processes similar to backtesting trading strategies where you test your model against historical data to see how it would have performed.
PM Pro Tip: Before finalizing your model, run a quick correlation matrix on your independent variables. If you see any two variables with a correlation above 0.7 or 0.8, that's a red flag. Consider combining them into a single metric or just dropping one of them.
Confusing Correlation with Causation
This is it. If you remember nothing else, remember this. Regression shows you that two things move together, but it cannot prove that one causes the other.
A model might show a strong, statistically significant link between users who use your new "Advanced Search" feature and higher retention. Great, right? But does the feature cause them to stick around? Or is it that your most engaged, loyal users—the ones who were going to stay anyway—are simply the ones most likely to discover and use an advanced feature in the first place?
Regression is a phenomenal tool for generating hypotheses. It points you where to look. But the only way to truly prove a feature's impact is with a controlled A/B test.
Use your analysis to decide what to test, not as a substitute for real experimentation. Making this distinction is what separates a junior analyst from a strategic product leader.
Common Questions About Regression for PMs
As an experienced PM leader, I've heard every question in the book. Here are direct, actionable answers to the questions that most often come up from PMs I've mentored, from entry-level to senior.
How Much Data Do I Need for a Reliable Regression Analysis?
There’s no magic number, but a solid rule of thumb is to have at least 10-20 observations for each independent variable.
For example, a PM at Spotify trying to predict user satisfaction with five factors (e.g., app speed, playlist recommendations, podcast availability) should aim for a bare minimum of 50-100 user survey responses.
For a simple linear regression with one predictor, you technically only need two data points. But to get a result you can actually trust, targeting 30 or more observations is a much safer bet.
The real key is having enough data to capture the true underlying signal without being misled by random noise. If your data is very "noisy"—meaning it has high variability—you will need a much larger sample size to detect a significant relationship.
Can I Use Regression Analysis to Prove Causation?
Absolutely not. This is the single most critical limitation for any PM to understand. Regression analysis can only identify and measure correlation—the degree to which two variables move together.
It can tell you that users who adopt Feature X are more likely to retain. That's a powerful insight! But it cannot prove that Feature X causes them to retain.
There could easily be a hidden (or lurking) variable at play. For example, maybe only your most engaged power users are the ones who discover Feature X in the first place. Their engagement is the real cause of their retention.
To establish causation, you must run a controlled experiment like an A/B test. Regression is a phenomenal tool for generating strong, data-backed hypotheses about what to test, but it is never a substitute for true experimentation. This distinction is a hallmark of a senior PM.
What Is the Difference Between Linear and Logistic Regression?
This all comes down to what you're trying to predict. Your choice depends entirely on the nature of your outcome variable. Getting this wrong is a fundamental error that will lead to flawed product decisions.
-
Use Linear Regression when your outcome is a continuous number.
- PM Example: Predicting the "dollar amount a customer will spend next month," the "number of minutes a user will be active," or the "expected LTV."
- Salary Impact: Senior PMs who can accurately model LTV command higher salaries, often in the $200k-$250k range, because this skill directly impacts revenue strategy.
-
Use Logistic Regression when your outcome is a categorical choice, usually a binary one (Yes/No, 0/1).
- PM Example: Predicting "whether a user will churn or not," "if a customer will click this ad," or "will a trial user convert to paid."
- Career Advancement: Building effective churn prediction models is a high-visibility project that can get a mid-career PM promoted to a senior role, as it demonstrates direct impact on core business metrics.
Choosing the wrong model for your question is an amateur mistake. Mastering this choice is a key step in your development as a product leader.
Ready to build the skills that get you hired and promoted? The Aakash Gupta newsletter and podcast provide the actionable frameworks and career insights you need to excel in product management. Learn from an experienced PM leader and join a community of thousands. Subscribe and listen here.