As a Product Manager in a platform or marketplace business—from a pre-seed startup to a giant like Uber or Airbnb—your success hinges on one metric above all others: take rate. It’s the commission your platform earns on every transaction it enables. Mastering this metric isn't just about understanding a formula; it's about owning a critical lever for revenue, growth, and your company's valuation.
When I was leading product teams at companies like Google and various startups, this was the number that tied every product decision directly to the P&L. It’s what VCs, your CEO, and senior leadership will grill you on. Why? Because it’s the purest measure of your platform's pricing power and monetization strategy.
Let's get straight to the actionable framework.
The PM's Take Rate Framework: Calculate, Benchmark, Optimize
For any PM, especially those in AI, fintech, or marketplace roles, your job isn't just to know what take rate is. It's to use it as a strategic weapon. Here is the three-step process we use to turn this metric into a growth engine.
Step 1: Calculate the Take Rate (The Right Way)
The formula looks simple, but its components are where junior PMs often make mistakes.
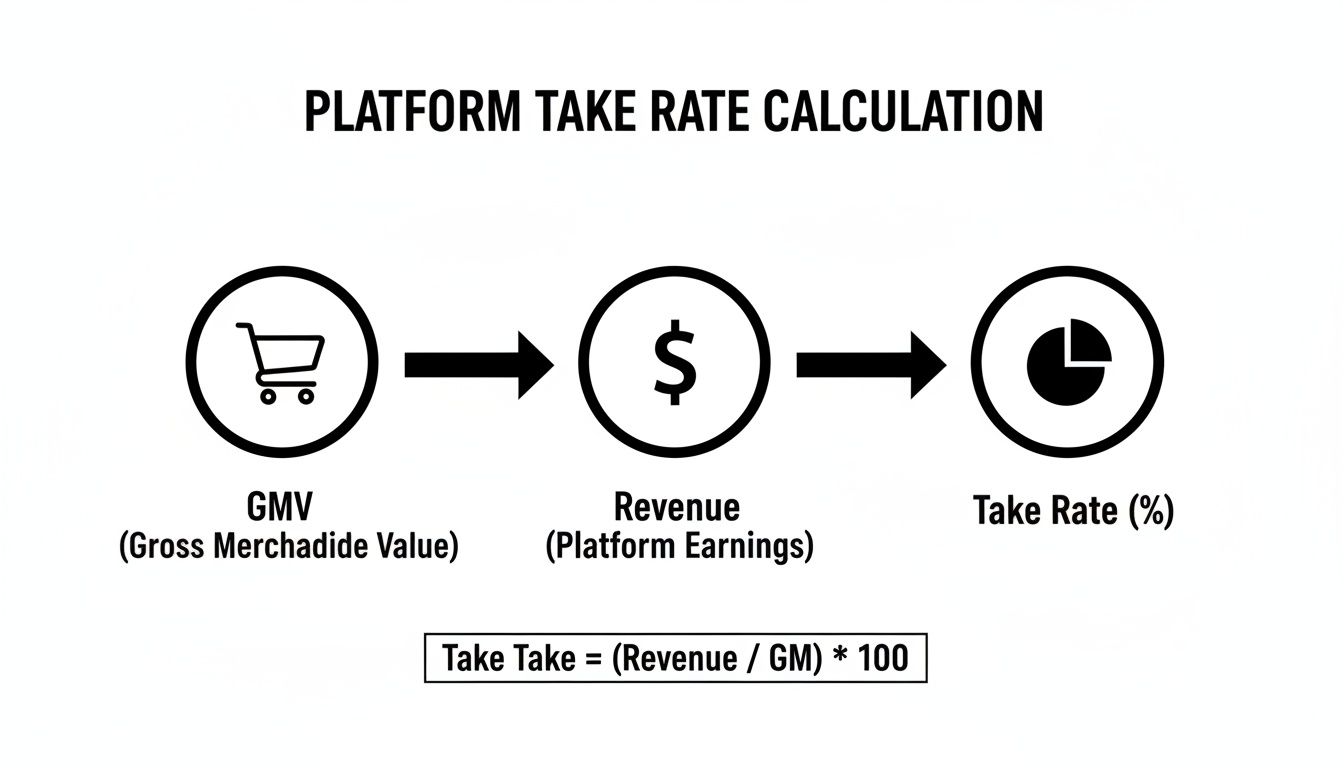
Take Rate = (Platform Net Revenue / Gross Merchandise Value) x 100
A 1% change here can mean millions in revenue, which is why it's a primary lever for growth. This is core to understanding marketplace growth strategies.
Breaking Down the Formula: A PM's Cheat Sheet
To calculate take rate with precision, you must master its two inputs. This is non-negotiable for any PM presenting to leadership.
| Metric | Definition for PMs | Where to Find It & Common Pitfalls |
|---|---|---|
| Gross Merchandise Value (GMV) | The total dollar value of all goods and services sold on your platform over a specific period, before any fees or expenses are deducted. It measures the size of your platform's economy. | Find: Your company's internal data warehouse or finance reports. Pitfall: Accidentally using a number that already excludes returns or cancellations. GMV is the gross, top-line transaction volume. |
| Platform Net Revenue | The portion of GMV your platform actually keeps after accounting for refunds, returns, and promotional discounts. This is your real top-line revenue. | Find: Your company's income statement. Pitfall: Using Gross Revenue. This is a cardinal sin. It inflates your take rate and gives a false signal of monetization efficiency. Always use Net Revenue. |
| Take Rate | The percentage of GMV that becomes platform net revenue. It measures your monetization efficiency and pricing power. | Calculated from the above two metrics. This is the KPI you own. |
Think of this table as your go-to reference before any planning meeting. In my experience, the PM who can speak precisely about Net Revenue vs. Gross Revenue is the one who gains credibility with the finance team and C-suite.
As a product manager, you’re constantly pulling levers—launching features, tweaking the UX, running marketing campaigns. But your take rate? That's not just another lever. It's your direct line to the P&L and, ultimately, your company's valuation. This isn't just another metric to track; for anyone leading a platform or marketplace, it’s a non-negotiable KPI.

That single percentage underpins everything from revenue forecasts to the very core of your business model. When your exec team or VCs want to size up your platform’s pricing power and competitive moat, they're looking at your take rate. It’s a raw, unfiltered reflection of the value you create—and what users are actually willing to pay for it.
The Goldilocks Problem for Product Managers
This brings us to the central challenge for every PM in this space: solving the "Goldilocks Problem." You have to set a rate that’s not too high, but not too low. It has to be just right.
Set it too high, and you’ll watch your sellers and creators flock to competitors. Imagine you’re running an NFT marketplace and set your fee at a steep 20%. If a rival platform is only charging 5%, you're going to lose transaction volume, and you're going to lose it fast.
But set it too low, and you're leaving a ton of money on the table. That starves your product of the cash it needs for innovation, marketing, and hiring top talent. It's a fine line that demands constant attention and strategic tweaks. Your ability to walk this tightrope is a huge differentiator in your career.
A well-calibrated take rate is a powerful signal of a healthy, defensible business model. It tells investors and leadership that you've found a sustainable way to capture value without destroying the ecosystem you've built.
From Metric to Strategy
Your take rate directly molds your unit economics, especially the all-important LTV:CAC ratio (Lifetime Value to Customer Acquisition Cost). A higher take rate boosts the LTV of every user on your platform. That, in turn, means you can afford to spend more to acquire new users, creating a powerful growth loop that can leave competitors in the dust.
Let's make it real. Say you manage to bump your take rate from 5% to 7%. That’s a 40% jump in revenue per transaction. This can radically improve your unit economics, suddenly making marketing channels that were once unprofitable totally viable. This is exactly why having a firm grasp of your P&L responsibility is so critical for senior PMs.
Ultimately, your take rate strategy is what dictates your company's ability to scale and maximize the overall profitability of apps and platforms. Being able to walk into a stakeholder meeting or board presentation and clearly articulate the business impact of these decisions is what separates a good PM from a great product leader. It shows you're not just building features; you're building a business.
Step 2: Analyze Real-World Take Rates (Like a VC)
Knowing the formula is table stakes. The skill that will advance your career is the ability to dissect a public company's earnings report and calculate their take rate yourself. This allows you to benchmark your own performance and understand the strategic moves of your competitors.
It’s a core competency I look for when hiring senior PMs.
Nuances PMs Must Master
Before jumping into the numbers, let's cover the details that trip up most people.
- Net vs. Gross Revenue: I'll say it again: always use net revenue. It strips out refunds and chargebacks, giving you the true picture of what the platform actually pockets.
- Blended Rates vs. Segmented Rates: Most large platforms have multiple business lines, each with its own take rate. Uber is the classic example with its Mobility (rides) and Delivery (Eats) segments. A top PM calculates both the blended, company-wide rate and the segmented rates to understand the true business drivers.
When an exec asks, "What's our take rate?" the sharpest answer is another question: "Are we talking about the blended rate, or a specific segment? And are we using net revenue?" This kind of precision shows you truly own the business.
Case Study 1: Airbnb's Dual-Sided Model
Airbnb is famous for its dual-sided take rate, where it charges both the guest and the host. It's a brilliant way to spread the fee out, making it feel less painful for everyone involved while still maximizing what Airbnb earns on each booking.
Let's analyze their Q4 2023 numbers:
- Gross Booking Value (GBV): $15.5 billion
- Net Revenue: $2.2 billion
Now, we plug those into our formula:
($2.2B Net Revenue / $15.5B GBV) x 100 = 14.2% Blended Take Rate
That 14.2% is a blended rate, combining the guest service fee (often over 10%) and the host service fee (typically around 3%). If you were a PM at Airbnb, your entire roadmap would be influenced by how tweaking either of those fees impacts booking volume, host acquisition, and the overall health of the marketplace. A job description for a PM role there would almost certainly list "experience with two-sided marketplace dynamics" as a key requirement.
Case Study 2: Uber's Segmented Take Rates
Uber's financials are a masterclass in segmented reporting. For Q4 2023, they reported:
- Mobility (Rides) Gross Bookings: $19.3 billion
- Mobility Revenue: $5.5 billion
- Delivery (Eats) Gross Bookings: $17.0 billion
- Delivery Revenue: $3.1 billion
Let's calculate the take rate for each business line:
- Mobility Take Rate:
($5.5B / $19.3B) x 100 = 28.5% - Delivery Take Rate:
($3.1B / $17.0B) x 100 = 18.2%
The difference is stark. Mobility commands a much higher take rate, reflecting Uber's dominant market position and pricing power in ridesharing. If you were a PM on Uber Eats, your world would revolve around closing that gap. Your quarterly goals would likely involve experiments on restaurant ad products, delivery fee structures, and subscription benefits to increase the effective take rate.
Looking at fintech gives you timeless lessons in building pricing power. For any PM at a growing startup, this is a critical case study in how take rate drives unit economics. Take Stripe, a modern product rocket. In 2023, it achieved a 2.8% blended take rate on an incredible $1 trillion in Total Payment Volume (TPV), up from 2.5% in 2021. That growth didn't just happen; it was driven by the adoption of premium features like their Radar fraud detection tool, which 80% of users now pay for. PayPal, another payments giant, has consistently held a take rate in the 2-3% range, proving the scalability of its model. You can read a full breakdown of these fintech take rate findings on Wall Street Mojo.
Decoding Take Rate Benchmarks Across Industries
Okay, you've got your take rate. The next question you'll get from your CEO or a VC is always the same: “Is it any good?” And as a product leader who's been in that hot seat more times than I can count, the only real answer is: it depends.
There’s no magic number. A 1% take rate sounds tiny, but for a volume machine like Stripe, it's a goldmine. Meanwhile, a gig economy platform might need 30% just to keep the lights on. The context of your market is everything, and understanding the benchmarks isn’t just about seeing how you stack up—it’s about building a business that can actually win.
Why Take Rates Vary So Drastically
Those wild swings in take rate from one industry to another aren't random. They're a direct reflection of how much value the platform is actually creating, the strength of its network effects, and the basic economics of the transactions happening on it.
Here are the big reasons for the differences:
- Value-Added Services: Is your platform just a simple matchmaker, or are you doing the heavy lifting? Things like payment processing, insurance, background checks, marketing tools, or handling logistics all add real value. DoorDash isn't just a list of menus; it’s a complex delivery network. That’s what justifies its 25-30% take rate.
- Average Transaction Value (ATV): If your marketplace runs on lots of small, frequent purchases (like food delivery), you need a higher take rate on each transaction to build a viable business. On the flip side, platforms with huge transaction values—think real estate or high-end cars—can do just fine with a much smaller percentage.
- Network Effects & Stickiness: How painful is it for users to leave you for a competitor? The harder it is, the more "sticky" your platform is. Strong network effects, where the product gets better for everyone as more people join, create this stickiness and give you more pricing power. Upwork's 10-20% rate is held up by its deep pool of vetted freelancers, which is incredibly difficult for a new competitor to copy.
At its core, the take rate is about turning the total value flowing through your platform (GMV) into actual revenue for your company.
Every dollar of revenue you earn is a piece of the pie that your platform helped create.
A Comparative Look at Industry Benchmarks
Having a solid grasp of these benchmarks is a career superpower for any product manager. It lets you walk into a strategy meeting and speak with real authority, shutting down unrealistic ideas and spotting genuine opportunities.
As a product leader, I’ve used tables like this to ground roadmap discussions in reality. When a team proposes a new feature to justify a take rate increase, the first question is always: "How does our rate compare to the value leaders in our vertical?"
To help you build that mental map, here’s a breakdown of typical take rates across different types of marketplaces.
Typical Marketplace Take Rates by Industry (2024 Benchmarks)
This table gives you a comparative look at average take rates across major sectors. It’s the kind of data that helps product managers ground their strategy in reality and benchmark their own performance.
| Industry/Platform Type | Typical Take Rate Range | Key Influencing Factors & Company Examples | Salary Range for Mid-Level PM |
|---|---|---|---|
| Product Marketplaces | 8-20% | Fulfillment (FBA), ads, payment processing. Ex: Amazon, Etsy. | $150k – $220k |
| Service Marketplaces | 10-20% | Escrow, project tools, dispute resolution, talent vetting. Tiered rates are common. Ex: Upwork, Fiverr. | $140k – $210k |
| Gig Economy | 20-30%+ | High operational costs (logistics, driver incentives), real-time support. Ex: DoorDash, Instacart. | $160k – $240k |
| App Stores | 15-30% | Global distribution, secure payments, dev tools, access to huge user base. Ex: Apple App Store, Google Play. | $170k – $250k+ |
| Travel & Experiences | 12-18% | Trust & safety (insurance), customer support, booking systems, brand marketing. Ex: Airbnb, Booking.com. | $165k – $235k |
| Payment Processors | 1-3% | Low value-add per transaction, but immense scale. Monetizes volume. Ex: Stripe, PayPal. | $175k – $260k+ |
The pattern here is crystal clear: the more a platform does to solve real problems, build trust, and give users essential tools, the higher the take rate it can justify. As a PM, your job is to relentlessly build that value. Only then can you earn the right to capture a fair piece of it.
Step 3: Use Actionable Strategies to Optimize Your Take Rate
Knowing your take rate is step one. Actually shaping it is where the best product managers separate themselves from the pack.
This isn't about just jacking up your fees and hoping for the best. That’s a rookie move. Optimizing take rate is a methodical game of hypothesizing, experimenting, and measuring. The goal is to capture more value by creating more value. This is the playbook I’ve used to grow revenue without torching the marketplace.

Let's be clear: optimizing your take rate is a delicate balancing act. You're trying to lift revenue capture, but you can't sacrifice the metrics that keep your platform alive: Gross Merchandise Value (GMV), user retention, and overall marketplace liquidity.
A short-term take rate bump that causes long-term user churn isn't a win. It's a failure.
Strategy 1: Introduce Tiered Pricing or Memberships
A one-size-fits-all fee structure is simple, but it's rarely optimal. Tiered pricing lets you match your take rate to the value different segments get from your platform. Your power sellers, for example—the ones who transact constantly or at high volumes—might be willing to pay a monthly fee for a lower per-transaction cut.
- Hypothesis: Introducing a "Pro Seller" tier with a monthly subscription fee and a lower take rate will increase our total revenue from the top 10% of sellers while also improving their retention.
- Experiment: Run an A/B test targeting a group of your high-volume sellers. Group A sees the standard take rate. Group B gets an offer to join the new Pro tier.
- Key Metrics to Monitor:
- Blended Take Rate: Does the new mix of subscription revenue plus lower transaction fees actually result in a higher effective take rate for this cohort?
- Seller Retention: Are Pro sellers sticking around longer than those in the control group?
- GMV per Seller: Does the lower fee incentivize Pro sellers to push more of their business through your platform instead of going off-platform?
Strategy 2: Create Value-Added Services (The AI PM Playbook)
This is the most powerful and sustainable way to increase your effective take rate. Instead of just grabbing a bigger slice of the pie, you're making the whole pie bigger. As an AI PM, your focus should be on identifying user problems that can be solved with data and machine learning, then monetizing those solutions.
- Promoted Listings / Discovery: Use ML models to offer sellers paid placement that has a high probability of conversion. Think Etsy or Amazon's sponsored products.
- Premium Analytics & Insights: Offer sellers AI-powered dashboards that predict sales trends, suggest pricing adjustments, or identify customer segments.
- Fraud Detection & Risk Management: Provide an advanced, AI-driven fraud prevention service for an additional fee, like Stripe does with Radar.
As a PM, your job is to be obsessed with your users' problems—even the ones they haven’t articulated yet. Find a pain point in their workflow that happens just before or just after they use your platform. Solve it, and you've found your next value-added service.
For a deeper dive into monetization models, you might be interested in our guide on developing a pricing strategy for new products.
Strategy 3: Implement Dynamic or Contextual Pricing
Why should a transaction in a quiet market on a Tuesday morning have the same take rate as one in a red-hot market on a Saturday night? A dynamic model lets you adjust fees based on real-time factors like supply, demand, or even transaction risk. This is standard practice in the gig economy, but the principle can be applied almost anywhere.
- Hypothesis: Applying a slightly higher take rate on transactions in high-demand, low-supply geographies will increase revenue without a significant hit to conversion rates.
- Experiment: Isolate a specific market segment, like "weekend bookings in downtown areas" for a service platform. Roll out a small 1% fee increase for only that segment and measure what happens.
- Key Metrics to Monitor:
- Conversion Rate: Do you see a meaningful drop in completed transactions in the test group compared to the control?
- Segmented Take Rate: What is the new, higher take rate for this specific context? Is the lift worth it?
- User Complaints: Keep a close eye on customer support channels. Are users noticing and complaining about the price difference?
Using AI to Generate Optimization Hypotheses
As an AI PM, I use large language models constantly to brainstorm and pressure-test growth ideas. You can do the same. Here’s a prompt you can steal and adapt for your next roadmap planning session.
AI Prompt for Take Rate Optimization:
Act as a Principal Product Manager at [Your Company or Competitor, e.g., 'Etsy'] specializing in marketplace monetization. Our current blended take rate is [Your Rate, e.g., 12%], based primarily on transaction and listing fees. Our primary seller segments are [Segment 1, e.g., 'hobbyist creators'] and [Segment 2, e.g., 'professional small businesses'].

Drawing on strategies from companies like Airbnb, Stripe, and DoorDash, generate 5 distinct, testable hypotheses for increasing our effective take rate. For each hypothesis, provide:
1.  The core strategy (e.g., Unbundling Services, Tiered Memberships, AI-powered Add-on).
2.  A specific, testable hypothesis in the format: "If we [action], then we expect [outcome] because [reason]."
3.  The primary North Star metric to measure success (e.g., 'Effective Take Rate for Pro Tier').
4.  The key counter-metric to watch for negative side effects (e.g., 'Churn Rate of New Sellers').
A prompt like this turns a vague goal into an actionable list of experiments you can bring to your next team meeting.
How to Monitor and Report Take Rate Effectively
A raw take rate number is interesting, but it's not the whole story. The mark of a strategic product manager isn't just calculating the number; it's building an operational framework around it that drives the entire company to action.
Your goal isn't to just report a static percentage. It's to build a narrative with your data. A well-crafted report can command attention in an executive meeting and genuinely shift your company’s strategic direction.
Building Your Marketplace Health Dashboard
Your take rate should never live on an island. Reporting it as a standalone number is a rookie mistake because it completely lacks context. A rising take rate might look fantastic, but if it comes at the cost of plummeting GMV or users fleeing your platform, you're actually destroying value.
This is why I insist my teams build a "Marketplace Health Dashboard." This dashboard puts take rate in its proper place—surrounded by the other core metrics that reveal the true health of your platform.
Your dashboard, likely built in a tool like Tableau or Looker, should track these metrics side-by-side:
- Blended Take Rate: The overall percentage for the entire platform.
- Gross Merchandise Value (GMV): The total value of all transactions. Is the pie itself growing or shrinking?
- Active Users (Buyers & Sellers): Are you growing participation on both sides of the marketplace?
- User Retention (Cohort-Based): Are users actually sticking around? A high take rate that causes churn is a massive red flag.
- Transaction Frequency: How often are people coming back to transact?
Once you have your take rate calculated, it's crucial to track subscriptions and other recurring revenue streams to get a complete picture. This gives you a holistic view and ensures your strategies are working as intended.
Uncovering Insights with Segmentation
The real magic happens when you start segmenting your data. A single, blended take rate often hides the most critical trends. By breaking down your numbers, you can spot hidden growth opportunities and diagnose problems before they spiral out of control.
A PM at a company I advise noticed the blended take rate had been flat for months. It looked stable, but not great. By segmenting, she discovered the take rate for their top seller cohort was actually declining as competitors poached them, while the rate for new, low-volume sellers was climbing. This insight completely flipped their retention strategy for power users.
Start by segmenting your take rate analysis by:
- User Cohort: How does take rate differ between brand-new users and your most loyal power users?
- Geography: Are there regional differences in pricing power or competitive pressure?
- Product Category: Do high-margin categories justify a higher take rate than low-margin ones?
- Transaction Size: Is your take rate optimized for both small-ticket and large-ticket purchases?
Visualizing Data to Tell a Compelling Story
How you present your data is just as important as the data itself. A confusing chart can kill a brilliant insight. Your job is to create visualizations that tell a clear, undeniable story to leadership.
For instance, use a stacked bar chart to show how different revenue streams (e.g., base commission vs. value-added services) contribute to your total take rate over time. This can visually prove the success of your optimization strategies at a single glance.
For a deeper dive into framing your wins, check out our guide on defining the right measurements of success. By mastering how you monitor and report take rate, you elevate your role from a feature-builder to a genuine strategic leader.
Frequently Asked Questions About Take Rate
I get asked these questions all the time by product leaders. Let's clear up some of the most common points of confusion so you can walk into your next strategy session and discuss take rate with real authority.
Getting these details right is what separates junior PMs from senior leaders.
What's The Difference Between Take Rate And Profit Margin?
This is easily the most common mix-up. Think of it this way: take rate is a top-line metric. It’s the slice of the total transaction value (GMV) that your platform keeps as revenue.
Profit margin, on the other hand, is a bottom-line metric. It's what's left after you subtract all your costs—salaries, marketing, servers, you name it—from that revenue. A marketplace could boast a healthy 15% take rate but still have a negative profit margin if its operating costs are out of control. They’re related, but they tell you two very different stories about your business.
How Should I Account For Refunds And Discounts?
You must always use Net Revenue to calculate your take rate. That means subtracting all the money that goes back to the customer—refunds, chargebacks, and any promotional discounts—from your Gross Revenue.
If you use Gross Revenue, you’re just fooling yourself. It will artificially pump up your take rate and give you a dangerously inaccurate picture of how well you're actually monetizing. For credible reporting, getting this detail right is non-negotiable.
How Should An Early-Stage Startup Set Its First Take Rate?
If you're a PM at a brand-new startup, your first job isn't to make a profit. It's to create a spark—to get activity going on your platform. That means you should start with a take rate that’s deliberately low, or maybe even 0%.
Your entire focus should be on solving that classic "chicken and egg" problem. You need to attract a critical mass of buyers and sellers to make the whole thing work.
A low initial take rate is a strategic investment in building network effects. Once you've established liquidity and proven your value proposition, you can begin methodically experimenting with introducing and increasing your take rate.
Is A Low Take Rate Ever A Good Thing?
Absolutely. A low take rate can be a deadly competitive weapon. Just look at giants like Shopify and Stripe. They built their empires on sub-3% take rates.
This wasn't an accident. It was a strategic choice to maximize transaction volume and make their ecosystems incredibly sticky for merchants. By putting seller success first with low fees, they fueled explosive GMV growth. That massive scale makes their business models incredibly difficult for anyone else to challenge. It's a classic long-term play, sacrificing short-term margin for total market dominance.
At Aakash Gupta, we focus on providing the frameworks and real-world examples you need to excel in your product career. For more deep dives like this, check out the resources at https://www.aakashg.com.