Effective market research isn't a checklist; it's a disciplined process for de-risking your product bets. As a Product Manager, your job is to define a crystal-clear objective, pick the right research method, collect clean data, find the patterns, and—most importantly—turn those findings into actionable recommendations that force a decision. This is how you move beyond guesswork and ground your roadmap in what the market is telling you, not what the highest-paid person in the room thinks.
The PM’s Market Research Playbook: From Data to Decision
Stop guessing. Start building products that customers will actually use and pay for.
As a Product Manager, solid market research is the bedrock of your entire strategy. Forget abstract theories. This guide is a tactical playbook, built from years in the trenches hiring and managing PMs at places like Google and Meta, designed to help you turn raw data into product decisions that get your stakeholders to say "yes."
At its core, market research is about one thing: reducing risk. A 2023 Qualtrics report found that 71% of organizations are leaning on research insights more heavily now than a year ago. Why? Because gut feelings don't survive board meetings. The cost of building the wrong thing is astronomical, not just in wasted engineering hours but in squandered market opportunity. For a Senior PM aiming for a Director role, a single major product flop can be a career-killer.

From Information to Impact
The difference between an average PM (making $150k) and a top-tier one (making $250k+) often comes down to their ability to translate information into impact. Market research is the engine for that transformation. It’s more than firing off a survey; it’s a systematic process for answering the toughest questions your business faces.
As a leader, I've seen countless projects go off the rails because of a lack of upfront research. The most successful PMs I've ever hired treat research not as a box to check, but as the central nervous system of their product strategy. They use it to kill bad ideas before they consume precious resources.
This guide gives you the same foundational approach I've used to:
- Validate new features before a single line of code is written.
- Size new markets to justify investment and set achievable goals.
- Understand customer churn by digging into the real "why" behind the numbers.
What This Guide Delivers
Unlike academic texts, this playbook is built for action. We'll walk through a framework that covers the entire process, end-to-end. You’ll learn how to define a razor-sharp objective, select the right methodology, and present your findings in a way that forces a decision from leadership. This is your roadmap for making smarter, faster, data-informed choices that will move your product and your career forward.
Step 1: Defining Your Research Goals and Scope
A research project without a clear objective is a fast track to a mountain of useless data. Before you even think about writing a survey question, you have to get ruthless about defining what you're trying to learn and, more importantly, why it matters to the business right now.
Vague business questions are where good research goes to die. "Should we build an AI feature?" isn't a research goal; it's a sign you haven't done the foundational thinking. Kick off a project with that, and you're guaranteed to get back ambiguous results nobody can act on.

From Vague Questions to Sharp Objectives
Your first job is to translate fuzzy stakeholder questions into specific, measurable research objectives. Are you trying to validate a new product concept? Dig into churn for a specific user segment? Or size a potential new market to justify a multi-million dollar investment? Each requires a different approach.
I've seen PMs at every level—from associate to principal—jump straight to methodology without locking down the "what" and "why." This is a classic mistake that wastes time, money, and political capital. When your research doesn't deliver a clear recommendation, stakeholders lose faith in the process.
To avoid this trap, I force my teams to use this simple framework:
- Business Problem: Start with the high-level business challenge. For example, "We're seeing a 15% increase in churn among our small business customers over the last two quarters."
- Research Question: Translate that into a core question. "What are the primary drivers of churn for our SMB customers, and what unmet needs could we address to improve retention?"
- Specific Objectives: Break the question into answerable pieces. These become the pillars of your research plan.
Your goal isn't just to gather data; it's to gather evidence that will force a decision. A well-defined objective acts as a filter, helping you say 'no' to interesting but irrelevant lines of inquiry that will bloat your project and dilute your findings.
Uncovering the Real Problem with Proven Frameworks
Often, the initial question you're given isn't the real problem. It's just a symptom. To get to the root cause, two frameworks are indispensable for any Product Manager.
The '5 Whys' Technique
This is a deceptively simple but powerful tool for digging deeper. By repeatedly asking "Why?" you can peel back the layers and move past surface-level issues to uncover the core of the problem.
Let's take our churn example:
- Why are SMB customers churning? They say the product is too expensive.
- Why do they feel it's too expensive? They aren't using the advanced features that justify the price.
- Why aren't they using those features? They don't know they exist or find them too complicated.
- Why don't they know they exist? Our onboarding flow doesn't effectively highlight them.
- Why is our onboarding ineffective? We designed it for enterprise users, not SMBs.
Boom. Your research isn't about pricing. It's about a failed onboarding experience for a key segment—a far more actionable problem.
The 'Jobs to Be Done' Framework (JTBD)
JTBD focuses on the "job" a customer is trying to accomplish, not the product they use. Customers don't buy a drill; they "hire" it to make a hole. This mindset shifts your focus from features to outcomes.
Instead of asking, "What features do you want?" you ask, "What are you trying to get done?" This reframing is a critical step in effective product discovery and balancing agility with effectiveness. It helps you understand the underlying motivation, which is where true product opportunities lie.
By setting clear goals and digging into the real problems, you create a solid foundation for your entire research effort. This ensures the insights you generate will lead to tangible product improvements and real business impact.
Step 2: Choosing Your Research Methodology
With your research goals locked in, the next decision is picking the right tool for the job. I've seen countless PMs default to surveys out of habit. But selecting the right methodology isn't just a process step—it's what guarantees the data you collect will actually answer your core questions.
The first fork in the road is choosing between primary and secondary research. Think of it this way: primary research is a bespoke suit tailored just for you, while secondary research is buying off the rack.
- Primary Research: Data you collect yourself, directly from the source (user interviews, surveys, usability tests). It’s custom-built for your specific objectives and gives you proprietary insights your competitors don't have.
- Secondary Research: Analyzing existing data someone else has compiled (industry reports, competitor analysis, academic studies). It's faster and cheaper, but it was never designed to answer your exact question.
For instance, to validate a new feature concept, there's no substitute for primary research like user interviews. On the other hand, if you're sizing a potential new market, secondary research from firms like Gartner can give you that crucial top-down view without a massive, expensive survey.
Qualitative vs. Quantitative: The What and The Why
The next layer is choosing between qualitative and quantitative methods. A rookie mistake is seeing these as opposing forces. The best PMs understand they're two sides of the same coin.
Qualitative Research is about exploration. It uncovers the underlying reasons, opinions, and motivations that drive behavior. It provides rich context and is perfect for forming early hypotheses.
- In-depth User Interviews: One-on-one conversations to dive deep into a user's world.
- Focus Groups: Small group discussions for gauging initial reactions. If you're going this route, learn how to conduct effective focus groups to get meaningful data.
- Observational Studies (Contextual Inquiry): Watching users interact with a product in their natural habitat.
Quantitative Research uses structured methods to generate hard numbers that can be statistically analyzed. This is how you validate hypotheses and measure trends at scale.
- Surveys: Collecting structured responses from a large, representative sample.
- A/B Testing: A classic for a reason. Compare two versions of something to see which one performs better.
- Analytics Analysis: Digging into user behavior data from tools like Amplitude or Google Analytics.
From my own experience, the most powerful insights almost always come from a blended approach. You start with qualitative research to uncover the 'why' and form a smart hypothesis. Then, you use quantitative methods to see if that hypothesis holds up at scale.
Let's say you have a new product idea. You might start with 10-15 customer interviews (qualitative) to identify their biggest pain points. If a common theme emerges—like, "managing team tasks is pure chaos"—you could then run a survey (quantitative) with 500 potential users to validate just how widespread that pain is.
Matching Methodology to Your Objective
The image below shows a team conducting primary, qualitative research through direct interviews to get inside their users' heads.
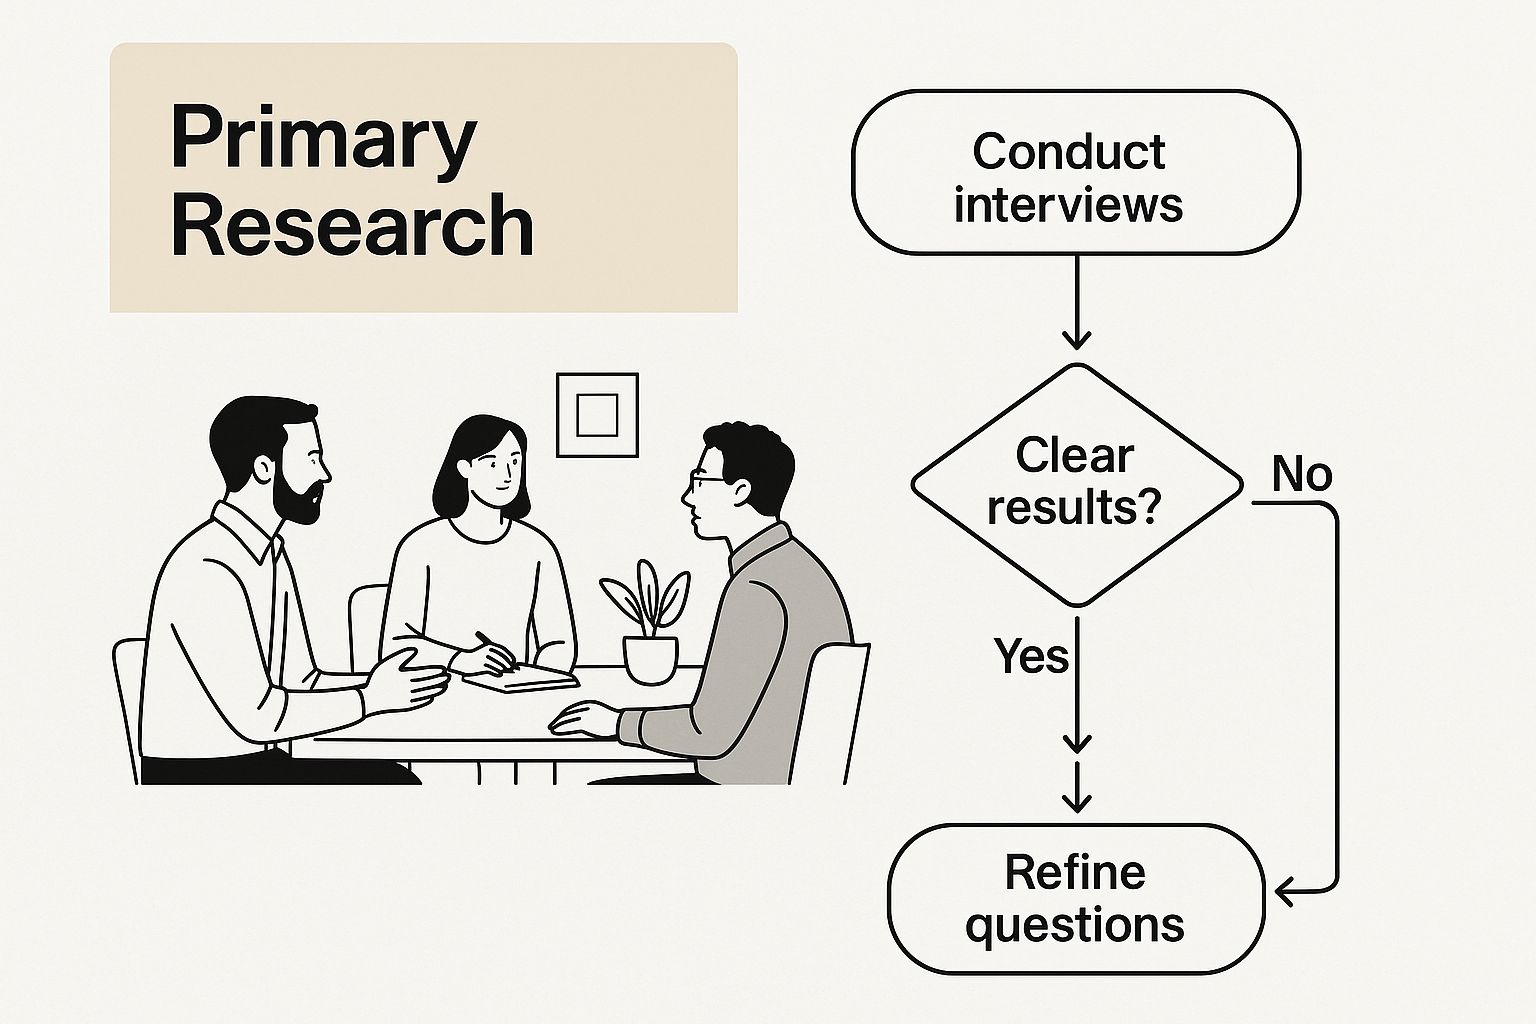
This kind of direct engagement is the heart and soul of primary research, giving teams firsthand data they can't get anywhere else.
Choosing the right approach always involves balancing your goals with real-world constraints like budget and timeline. A PM at a seed-stage startup might lean on scrappy, qualitative interviews. A PM at Meta could deploy large-scale quantitative surveys backed by a dedicated research team.
To make this concrete, here's a cheat sheet I use to map product questions to the right research methodology.
Actionable Framework: Choosing the Right Market Research Method
| Research Question Type | Best Methodology (Qualitative/Quantitative) | Specific Tools/Techniques | When to Use It |
|---|---|---|---|
| Why are users churning? | Qualitative | Exit Interviews, 1-on-1 User Interviews | When you need to understand the deep, nuanced reasons behind a metric. |
| How big is the market for X? | Quantitative | Secondary Research (Gartner, Forrester reports), Market Surveys | Early-stage exploration to validate the potential size of an opportunity. |
| Which feature should we prioritize next quarter? | Quantitative | MaxDiff Surveys, A/B Testing (for existing features) | When you have a list of validated ideas and need to make a data-backed priority call. |
| How do users feel about our new design? | Qualitative | Usability Testing (via UserTesting.com), Focus Groups | Before shipping a major UI/UX change to get feedback on intuition and feel. |
| Is our new onboarding flow effective? | Both | Usability Testing (Qual) + Funnel Analysis in Amplitude (Quant) | To see both where users are dropping off and why they're struggling. |
Ultimately, your methodology is the bridge between your questions and your answers. By thoughtfully mixing and matching methods, you set your project up to deliver the clear, actionable insights needed to push your product forward.
Step 3: Executing Data Collection Like a Pro
With a solid plan, it’s time to execute. The precision you apply here is what separates amateur efforts from professional-grade research that leaders trust.
Sloppy execution can invalidate the most brilliant research plan, wasting time and eroding confidence. The goal isn't just to gather data; it's to collect clean, unbiased information that directly addresses the objectives you worked so hard to define.
Mastering Qualitative Data Collection
For qualitative research, your job is to become a detective of deep motivations, not just a stenographer. Conducting unbiased user interviews is a skill that takes practice, but you can get dramatically better results just by focusing on how you ask questions.
The biggest mistake? Leading the witness. A bad question sounds like: "Wouldn't it be great if we added a feature that did X?" This primes the user to agree with you. A better approach explores their reality.
Effective, Unbiased Interview Prompts:
- To uncover pain points: "Walk me through the last time you tried to accomplish [task]. What did that process look like?"
- To understand motivations: "What's the main reason you're trying to solve [problem]? What would a perfect outcome look like for you?"
- To reveal workarounds: "When you run into [challenge], what do you do to get around it? Show me."
These prompts force the user to tell a story based on past behavior, which is a far more reliable indicator of future needs than a hypothetical question. Your goal is to listen 90% of the time.
A common mistake I see junior PMs make is talking too much during user interviews. They get excited and start pitching their solution. The moment you start selling, you stop learning. Your only job is to understand their world, their problems, and their context.
Designing High-Impact Quantitative Surveys
When it's time to validate your qualitative findings at scale, a well-designed survey is your best friend. But a bad one is worse than nothing—it's actively misleading.
Here's my go-to checklist for getting it right:
Survey Design Checklist:
- Start with Demographics: Get the basics out of the way first (role, industry, company size) for easy segmentation during analysis.
- Use Clear, Simple Language: Ditch the jargon. If a question is confusing, you'll get garbage data.
- Ask One Thing at a Time: Don't combine two ideas, like "Was our support fast and helpful?" Split them up.
- Avoid Leading Questions: Instead of "How much do you love our new feature?" ask "How would you rate your experience with our new feature on a scale of 1-5?"
- Keep It Concise: Respect your users' time. Every extra question lowers your completion rate. If it’s not essential to your core objective, cut it.
Recruiting the Right Participants
The quality of your insights is a direct reflection of your participants. Getting this wrong means you're collecting data from the wrong people, making your results irrelevant.
You have two main paths: tapping into your existing user base or using a third-party panel.
Recruiting Panel vs. Existing Customers
| Method | Pros | Cons | Best For… |
|---|---|---|---|
| Recruiting Panels (e.g., UserTesting.com) | Fast access to specific demographics. Reduces bias by recruiting outside your bubble. | Can be expensive. Participants may be "professional testers." | Reaching non-customers, sizing a new market, or getting unbiased concept feedback. |
| Existing Customer Base | Cost-effective. Participants already have context on your product. | Can introduce bias (they already like you). May not represent the broader market. | Understanding churn, validating a new feature for current users, or gathering satisfaction data. |
Your choice of tools—from SurveyMonkey for broad surveys to UserTesting.com for moderated usability studies—and recruitment strategy must align with your research goals. Meticulous execution ensures the insights you deliver are built on a foundation of truth.
Step 4: Analyzing Data and Synthesizing Actionable Insights
Collecting data is just the beginning. The real work starts when the spreadsheets and transcripts pile up. As a Product Manager, your highest-leverage skill is turning that raw noise into a clear signal that guides your product roadmap.
This is the moment you shift from observer to strategist. The goal isn't a 50-page report nobody will read. It's to find the story hidden in the data and translate it into clear, undeniable product recommendations.
From Raw Notes to Recurring Themes
With qualitative data—rich, messy context from user interviews—your first job is to spot the patterns. Two techniques are essential.
First, Thematic Analysis. Comb through transcripts and notes to identify recurring ideas, pain points, and motivations. You're digging for the "why."
Then, Affinity Mapping, a low-fi but powerful method to visualize themes:
- Write every single observation, quote, or idea on a separate sticky note.
- Start grouping related notes on a wall or whiteboard. Look for natural connections.
- As clusters form, name each group. These are your emerging themes, like "Frustration with Onboarding," "Wants Better Collaboration Tools," or "Confused About Pricing."
For remote teams, digital tools like Dovetail or Miro are fantastic for this. They let you tag, cluster, and analyze qualitative data much faster. The process will reveal the most pressing user needs, straight from their own words.
Turning Numbers into Narratives
Quantitative data gives you the "what" and "how many." It’s how you validate qualitative themes at scale. But a spreadsheet full of numbers isn't compelling. Your job is to make it make sense.
Start with the basics: average satisfaction score, percentage of users completing the onboarding funnel. Then, dig deeper by segmenting the data. Do users on the free plan churn more than paid users? Is a feature used more by SMBs than enterprise customers?
This is where visualization tools like Tableau or Looker are critical. A simple bar chart showing a 40% drop-off at a specific step in your sign-up flow is infinitely more powerful than a row of numbers in a spreadsheet. It tells a story instantly.
The most common mistake PMs make is stopping at the data point. Your job isn't to report that '73% of users clicked button A.' It's to synthesize that into an insight: 'Our new UI is successfully driving engagement with the primary CTA, but the copy on button B is unclear, causing user friction.'
This synthesis is the bridge from data to action. It’s what separates a data-driven PM from someone who just reports metrics. Understanding how to foster data-driven product teams is a crucial first step.
Leveraging AI for Accelerated Insights
Manually sifting through thousands of survey responses is no longer feasible. This is where AI tools are becoming a PM's superpower. Modern tools like OpenAI's GPT-4 can run thematic analysis on massive, unstructured datasets in minutes.
Example Prompt for ChatGPT-4:
"Analyze these 500 open-ended survey responses about our SaaS product. Identify the top 5 recurring themes related to user frustration. For each theme, provide 3 direct quotes that exemplify the issue and suggest a potential product improvement."
This frees you to focus on the higher-level strategic work: interpreting the findings and building a case for what to do next. Adopting these tools isn't just about speed; it's about staying competitive.
Step 5: Presenting Your Findings to Drive Action
An insight that doesn't lead to action is a wasted effort. After weeks of work, your final job is to get stakeholders to actually do something with what you've found.
Too many PMs deliver a data dump—a long walkthrough of everything they learned. This is a mistake. Your execs don't have time for the scenic route; they need the destination upfront. Your presentation must be a tool for persuasion, not just a report.
From Data to Decisions
The best research presentations are structured like an inverted pyramid, starting with the answer first. Your very first slide should have your single most important takeaway and your core recommendation. This immediately frames the conversation around action.
I’ve seen PMs spend 20 minutes building up to their big reveal, only to lose their audience's attention by slide three. Start with the conclusion. If your VP of Product only remembers one thing from your presentation, make sure it’s the most important one.
This respects the time of senior leaders and forces you to be ruthlessly clear in your own thinking. Every slide that follows should exist for one reason: to support that initial, powerful recommendation.
Structuring Your Research Readout for Maximum Impact
To translate your hard work into business impact, structure your presentation deck to tell a compelling story. Don't just show charts; explain what they mean for the business.
Here's a battle-tested structure for your readout deck:
- Slide 1: The Executive Summary: State the research objective, your single biggest finding, and your top recommendation. Get straight to the point.
- Slides 2-4: Key Findings: Dedicate one slide to each major theme. Bring the user's voice into the room with powerful quotes and clear data visualizations.
- Slides 5-7: Supporting Evidence: For each finding, include a follow-up slide with the specific data—quantitative charts or qualitative excerpts—that proves your point.
- Slide 8: Product Recommendations: Clearly outline what the team should do next. These recommendations must be specific, actionable, and directly tied to your findings.
A weak recommendation is "improve the onboarding flow." A strong one is "Redesign step three of our onboarding flow to include a product tour video, as 65% of users reported feeling lost at this exact point." Specificity drives action.
Anticipating Pushback and Driving Alignment
Presenting research isn't a monologue. Expect stakeholders to have questions and push back. This is a good thing—it means they're engaged. Your job is to be ready.
Before the meeting, anticipate the tough questions. Role-play the presentation with a trusted colleague. Who will care most about the financial impact? Who will jump to technical feasibility? Tailor your talking points to address their concerns proactively.
Ultimately, your findings should directly influence what comes next. A great research project delivers clear, data-backed inputs that help your team make better decisions. By presenting your insights this way, you can confidently determine what to build, what to fix, and what to ignore, making it a critical input for anyone looking to learn how to prioritize a roadmap with conviction. This is how you transform research from an academic exercise into a strategic advantage.
Frequently Asked Questions About Market Research
Even the most seasoned PMs hit roadblocks with market research. Over the years, I've seen the same questions pop up again and again in my teams. Here are the most common ones, with straight-up, actionable advice.
How Much Should We Budget for Market Research?
There’s no magic number. The budget depends on your company’s stage, the risk of the decision, and the methods you use. A seed-stage startup might have a budget of $0, getting by with scrappy user interviews. A behemoth like Meta could easily drop $250,000 on a global quantitative study.
A good rule of thumb? Match the research investment to the potential impact. If you're about to make a $5 million product bet, spending $25,000 to de-risk it is a no-brainer.
The biggest mistake I see is teams viewing research as a cost instead of an investment. Trust me, the cost of building the wrong thing is always exponentially higher than the cost of figuring out your market upfront.
For most mid-stage companies, allocate a percentage of your total product development budget to research. Aiming for 1-3% is a solid starting point. This provides dedicated funds for both quick validation and deeper exploratory work.
How Do I Know When I’ve Done Enough Research?
You’ll never have 100% complete information. The goal is to reduce uncertainty enough to make a confident decision. You know you're there when you hit the point of diminishing returns.
This is when new interviews or surveys stop revealing fresh insights and just keep confirming what you already know. For qualitative work, this "saturation point" often happens after talking to 10-15 people per user segment. For quantitative work, it's when your results stabilize. Once you can confidently answer your core research questions, it's time to stop.
What if the Research Findings Contradict a Stakeholder’s Opinion?
This is going to happen. It's not a matter of if, but when. Handling it with grace is a critical PM skill.
The worst thing you can do is frame it as "you were wrong." Your job is to bring new, objective evidence to the table, not to win an argument.
Start by acknowledging their perspective. Then, present the data dispassionately. Let the customer's voice do the talking. Use direct quotes, video clips from user sessions, and hard numbers. This depersonalizes the feedback and shifts the conversation from a battle of opinions to a shared mission to understand the customer's reality.
The global market research industry has shot up from $39.47 billion in 2012 to an estimated $140 billion in 2024—a growth of over 250%. This massive global shift away from gut feelings gives you a powerful tailwind when presenting data that might be hard to hear. You can learn more about these market research industry trends and what they mean for product strategy.
How Often Should I Be Conducting Market Research?
Market research isn't a one-and-done project. The best PMs treat it as a continuous process. You have to build a constant feedback loop with your market.
Here’s a simple cadence you can steal:
- Weekly: Talk to at least one customer. This could be hopping on a support call or reviewing a session recording. Just get direct exposure.
- Monthly: Dig into key metrics and customer feedback channels (support tickets, app store reviews, social media). Look for emerging patterns.
- Quarterly: This is the time for formal research projects tied to your upcoming roadmap, like validating a new feature concept or exploring a new user segment.
This "continuous discovery" mindset is what keeps your product strategy tethered to what customers actually need.
At Aakash Gupta, we're dedicated to helping you master skills like these to accelerate your career. Get more actionable frameworks and expert insights by subscribing to the newsletter and podcast.