Let’s find companies who are going through product. Because who cares about Unicorns?
We have unicorns and decacorns as terms, but for product professionals, what matters more – market cap, or how that market cap was achieved? Product people do not care about the market cap. Product people do not care about slow growth companies either. Our goal is to identify high growth product companies, the product growth all stars. We want to know how those all stars achieved their market cap.
Think about Tesla. The company spends no money on advertising. It has no PR department. Yet it has had exponential growth in deliveries:
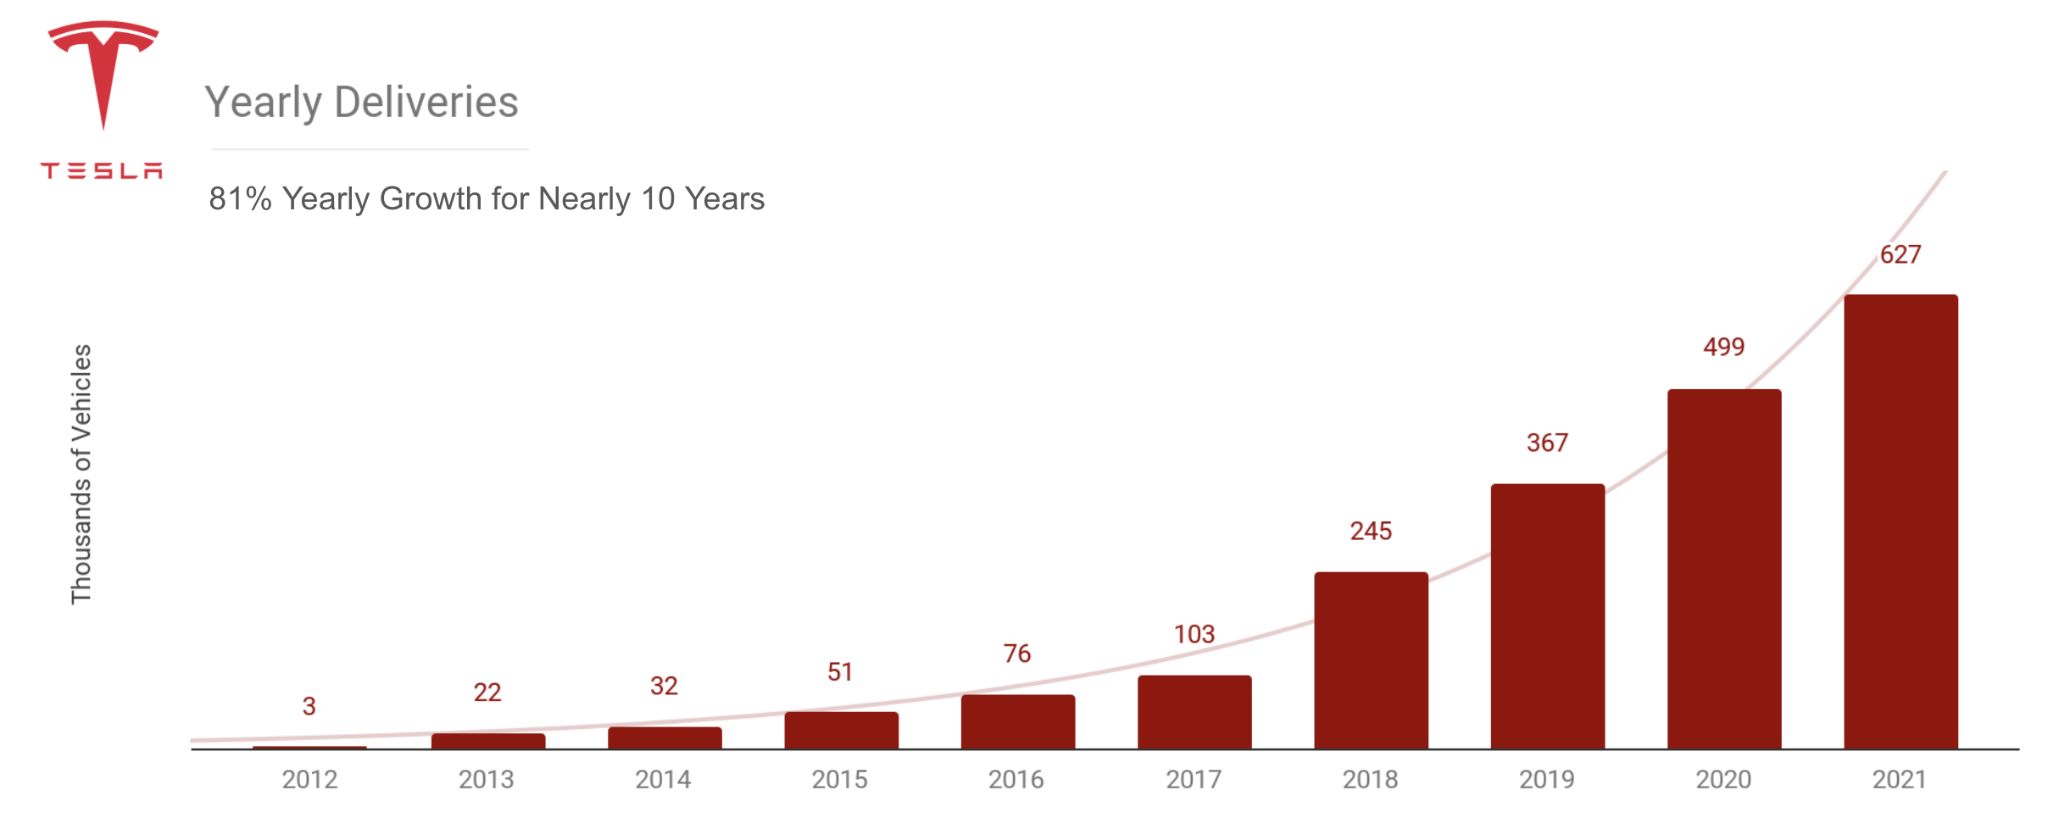
But we all know the Tesla story. Teslas are probably everywhere, up and down the market cap spectrum. We want to find those companies investing in product development, across industries, to grow. While Tesla is in the automotive industry, what about the companies in software? We just lack the context to find them. How can we identify these companies?
In this piece, I will run through my thinking on metrics, share the results, and analyze them. I call them product rockets.
How do we find product rockets?
Goals and Limitations of Metrics
To come up with good metrics is probably the most challenging part of building this list. But to at least get started in identifying metrics, we want to start with goals. There are a couple of them. We want metrics that stand the test of time, are widely applicable, and generate the types of companies we expect to see atop the rankings. We also do not want to generate 10 or 25 metrics to identify product led companies. We want one or two to easily index on and build context off of.
Ideally, we would measure product growth specifically. Product professionals work with analysts to carefully design tests to measure feature impacts. This data would be best. It looks something like this:

But not all companies do. And, even if every company did have this information, it is normally not shared. So, many of the ideal metrics are not available. What metrics do we have available? Those that public companies report, the three financial statements. Fortunately, there are 488 public tech companies. So we at least have a big sample for our limited metrics. As a result, the limiter in choosing metrics is really finding one’s that make it to international financial statements.
Choosing Growth and Product Metrics
When I attended business school, my finance professor, Stephan Dieckmann, said:
I’ll take one analyst who understands the three financial statements over 10 writers anyday.
His point? Anyone can tell a story, but the numbers count. Product growth storytellers often disregard the three core financial statements. But, almost all companies report these:
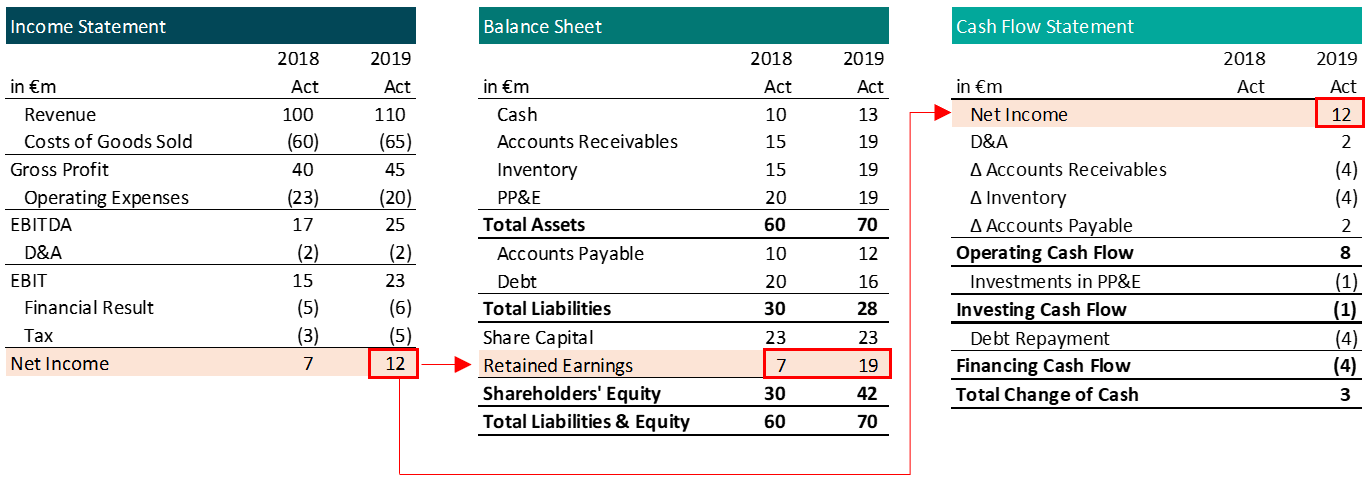
Image: Merger Strategy
So, let us rise to the challenge and identify metrics using the financial statements as our data. The first question is: what growth metric to use?
Net income is the metric that connects the three financial statements. Would that be a good choice? The problem with net income is that few technology companies pay attention to it. Positive net income, these days, seems ro be a metric you see in $100B+ market caps.
Perhaps revenue? That is the metric of a company growing, at least in terms of money it accrues to itself. But, many early-stage technology companies do not prioritize this. So in that case, this metric would be flawed.
Overall, for most public companies, revenue matters. Even if it is not the company’s north star, because the companies typically trade on a revenue multiple, executives care. For our purposes and company data set, it seems good enough.
Certainly, gaming companies would argue for billings. Social media companies would argue for active users. There are better sub industry specific metrics. But, across industries, revenue appears the best amongst three so-so options.
We are looking for a growth metric, so, specifically, revenue growth rate. One could define revenue growth rate in many ways. For this exercise, we are particularly interested in recency. We want companies who have recently released product features and experienced revenue growth as a result. That typically takes a year. So let us look at year over year revenue growth in the latest reported financial quarter. We have found our first metric.
Then, the next question is, what product metric to use?
From the top level of the three financial statements, there does not appear to be a clear candidate. We need to pry a level deeper into operating expenses on the income statement.
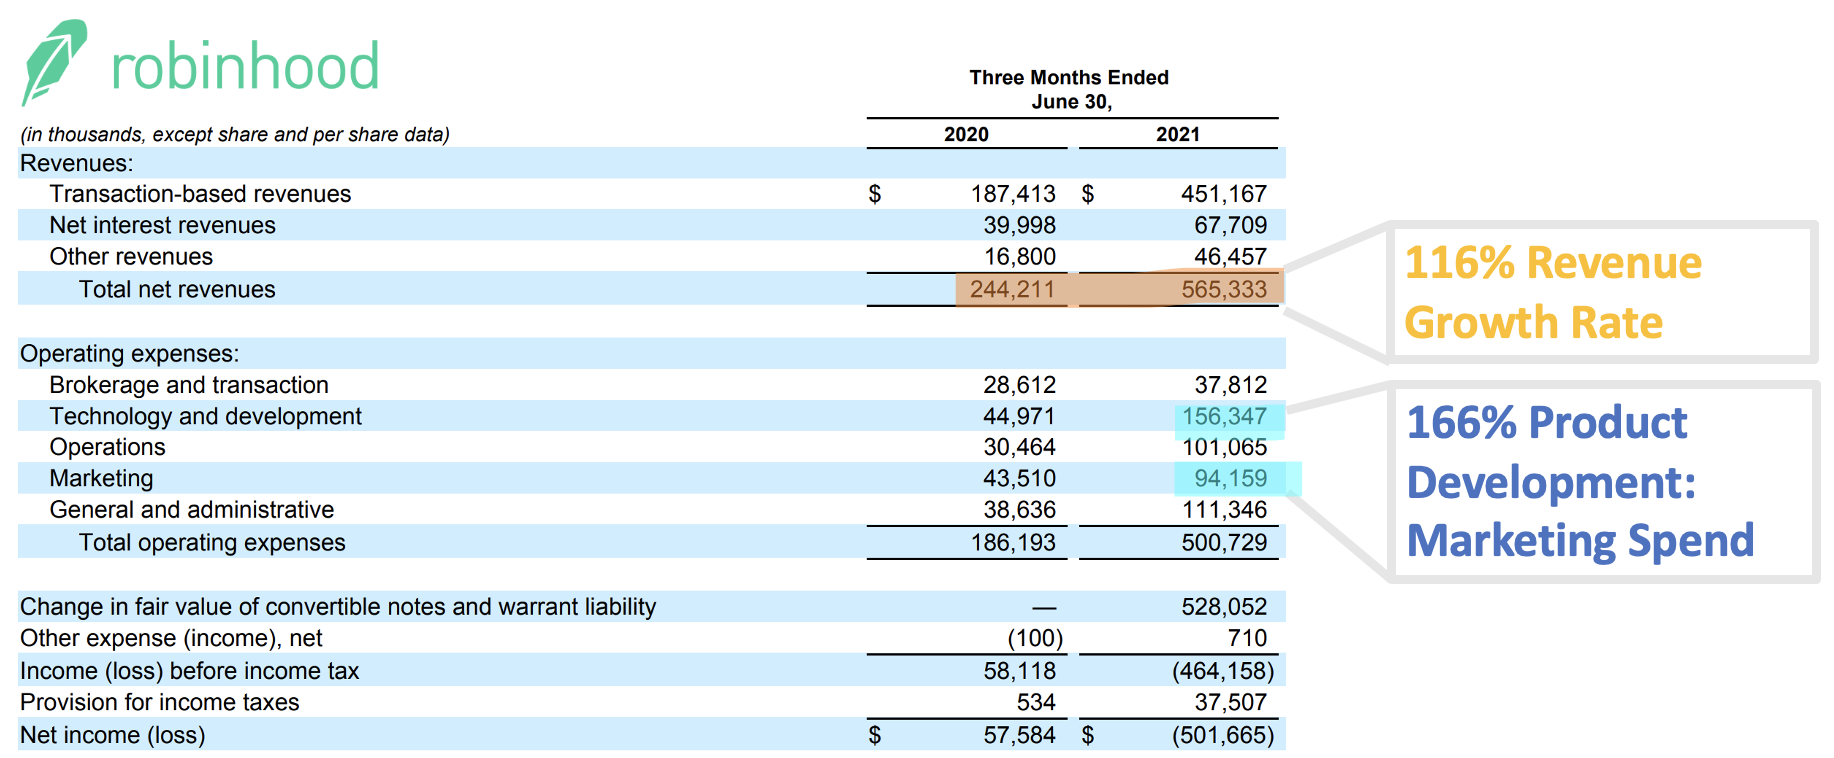
On income statements, one interesting element is that most companies report sales & marketing and product development (sometimes labelled R&D) spend as separate categories:
- Product development typically incorporates the key product investments. This includes the engineers, designers, and product people responsible for product growth.
- Sales & marketing usually covers the media & the people behind those teams.
How these companies define the categories can vary widely. But they may be the best we have.
Therefore, we can take the ratio of product development to marketing spend. This ratio helps us identify companies that spend relatively more on distribution or product.
To summarize, here are the two metrics we have landed on:
- Revenue growth rate
- Product development: Sales & marketing spend ratio
What could go wrong?
Perhaps most importantly, spending may not accurately reflect drivers of growth. A company may spend a lot on a function but get much less out of it than another firm that spends much more. But, it is the best we have.
Then there is also the accounting. Boring sometimes, but important in this case:
Revenue growth rate is a fraught metric. As we discussed above, it hurts companies investing in user or engagement growth first. It misses stories where the monetization is to come or improve dramatically. It also does not go straight to profits. Margins matter, but we can use feel to prune that. Revenue to me is a signal that these are the true product growth rockets that we want to look for, study, write about, and read about.
The product development and sales and marketing operating expenses line items are not perfect either. Companies define them differently. Generally, the product development line item will include growth engineers. Some might argue those are essentially a marketing expense. In addition, stock based compensation can be booked differently.
Product Rocket Data Set
With those caveats in mind, let us run the numbers. To get a sample set we could analyze well, I took all the most important product growth companies I know well:
- Companies most written about in a growth context: Airbnb, Uber, and Dropbox
- Product growth all-stars: Robinhood, Atlassian, Snowflake, Square, and Shopify
- Fast growing mid-caps: Snap, Datadog, Docusign, Servicenow, and Zoom
- FAANG: Most actually do not split operating expenses into sales/marketing and product development. Alibaba, Microsoft, Google, and Facebook do
- The original: PayPal
You might be surprised by some of these growth rates:
Different technology companies felt differing pandemic tailwinds. Airbnb & Uber may have benefited from pandemic comps more than enterprise software companies. So, there is something to be said for thinking about longer revenue growth rate trends. The trade off is recency. The goal of this list is recency, so we will keep it this way.
The Product Rockets 🚀
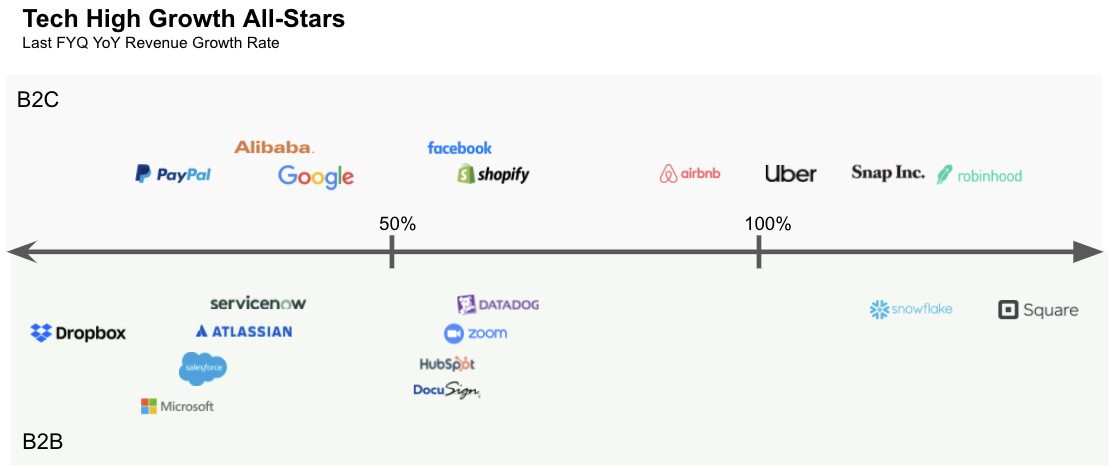
When we take those companies and run the numbers against the ratio of product development: sales/marketing spend, the results looks like a pretty good way to identify product rockets:
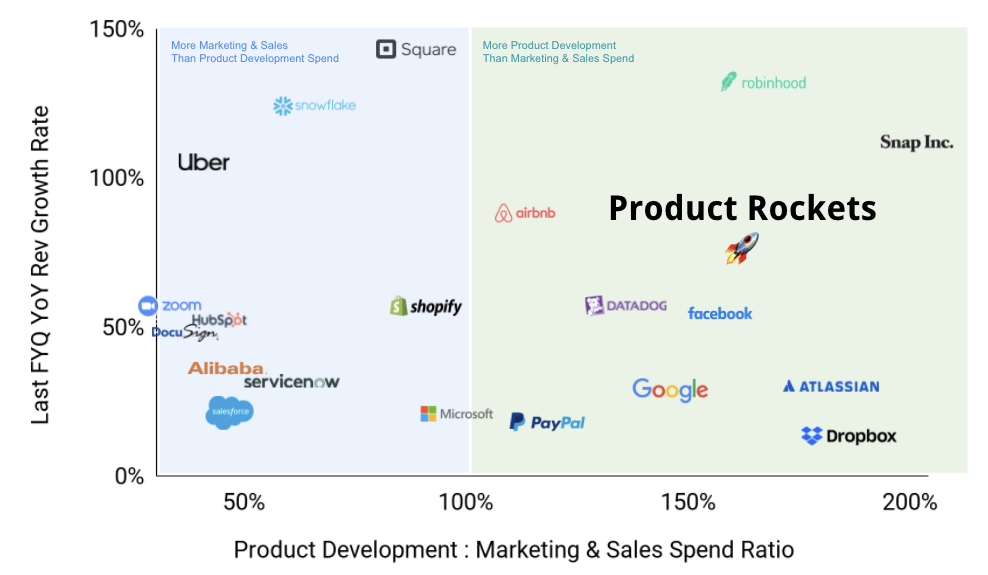
Using this framework, Robinhood, Snap, Datadog, Airbnb, and Facebook, rise to the top of the heap. These companies over-index on product development spend compared to marketing & sales, and have phenomenal growth.
These four companies actually match my inherent read of the companies as someone who works on product growth. In the last year, all four companies have released significant features to drive product growth. To name a few for each:
- Robinhood: democratized the IPO process forever by opening it up to retail investors, had several IPOs including its own, launched new learning modules, and started 24/7 phone customer support
- Snap: new AR lenses, new way to say happy birthday, profiles with 3d bitmoji, expanded music library, and new snap originals
- Datadog: cloud security platform, deep database monitoring, Salesforce platform monitoring and threat detection, Windows server live traffic monitoring
- Airbnb: new way to search, new 10-step host onboarding, faster checkout process, refreshed cancellations
- Facebook: music on facebook gaming, messenger poll games and word effects, horizon workrooms, sensitive content control on instagram, live shopping Fridays
The lists of features for each of these companies is gargantuan. They are true investors in product.
The enterprise space highlights how that type of investment is not a guarantee. The top growers, Datadog and Zoom, could not be more different. Zoom spends very little on product development. Datadog spends much more. And then in the same sector, Atlassian spends even more on product development compared to sales & marketing than Datadog (although it isn’t growing quite as fast).
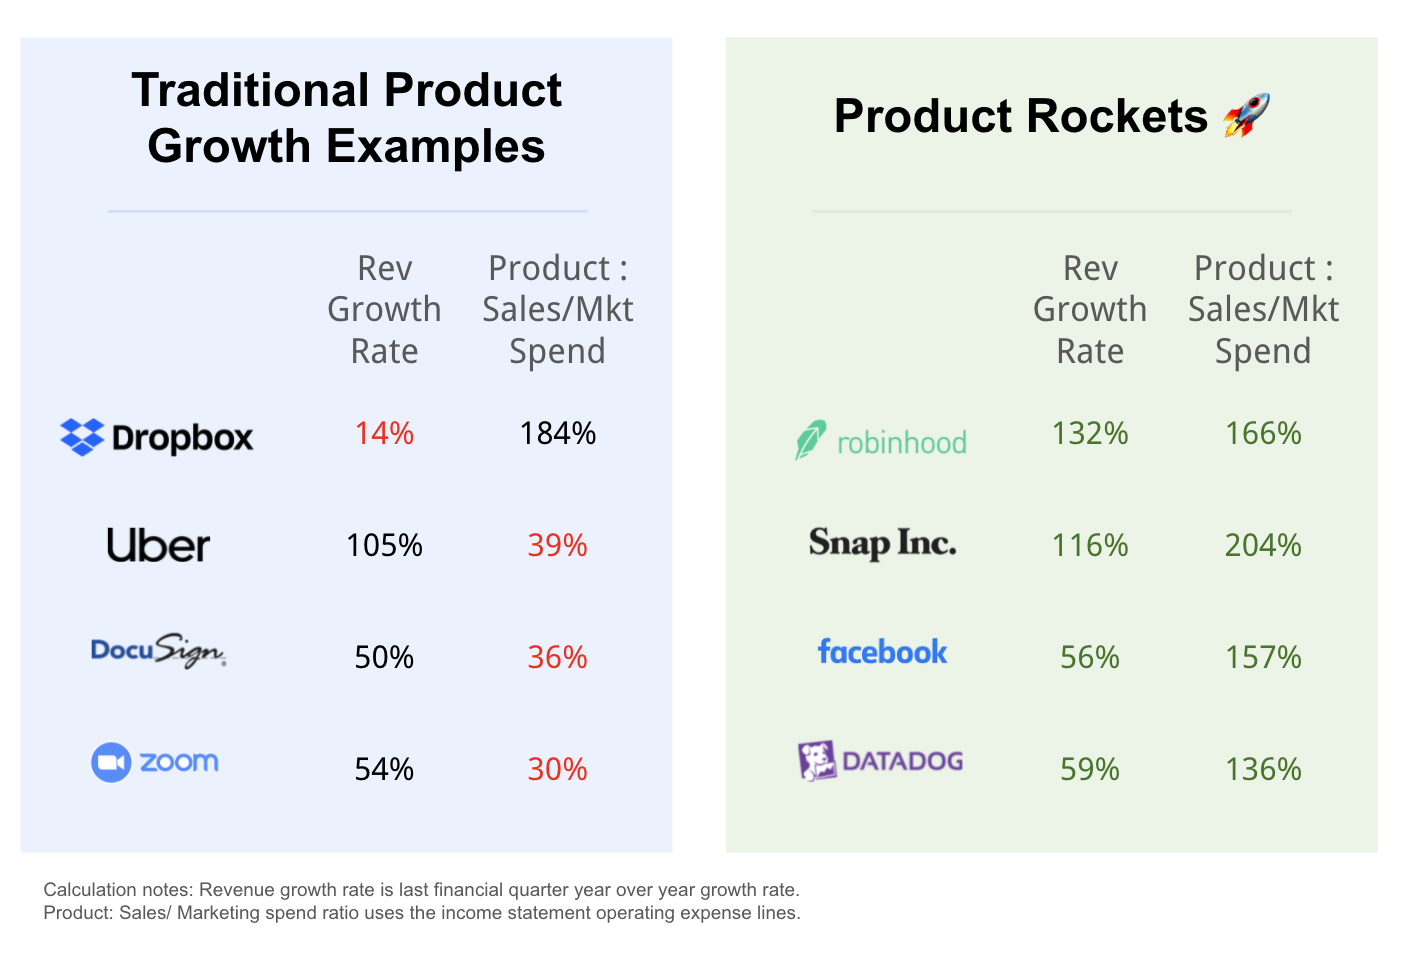
This list reads quite differently than the traditional product growth examples we are sold in most articles and content:
Pressure-testing the list
There are a variety of data points we would first want to confirm when looking at an analysis like this. PayPal, as I have written about before, is the original product growth company. We see it accurately represented in the category of companies that spend more on product development than sales & marketing. But because of its relatively low overall growth rate, it did not quite make the current leaderboard for product rockets.
Then we have Facebook. They by far have the biggest product growth staff in the industry. Based on LinkedIn searches, I estimate their team is about 9,000 strong, when you include product, design, engineering, analytics, and the other supporting teams like legal and ops. Facebook does turn out to be rated as a product rocket here. So that helps validate the list.
On the other side of the spectrum, we have salesforce. They are known to have a strong sales and marketing investment, because they sell into those departments. They rightly show up to the lower left of this chart because their revenue growth rate is also slower.
What companies seem off?
Zoom is the company that most would argue seems off here. It has grown tremendously, and most people attribute this to its superior product. But let us double click there. We are looking at the latest financial quarter compared to the year before. In that timeframe for growth, Zoom is middle of the pack in this peer set. The question is, “is the product driving the growth Zoom saw in the last year?”
From a company narrative perspective, I can see how this last quarter of growth for Zoom is coming from marketing & sales. The product growth came before covid-19, then there was market growth, and now the company is hitting the slower adopters with sales teams. The data seems to suggest a story like that. The company is spending 27% of its revenue on sales & marketing. That is right in the middle of this list. On the other hand, the company is spending a mere 8% of its revenue on product development. That is right near the bottom of this list. What growth features has Zoom shipped that you can point to recently?
To some extent, I do agree that Zoom seems odd where it is placed here. Diving into Zoom, can you suggest a better metric? Perhaps something around efficiency of growth from product spend, discarding high marketing as a percentage of revenue spenders. We will look into metrics like that in future editions of the newsletter.
Why isn’t X company on the list?
Tesla, Apple, and a few other companies of interest did not break out the metrics in the way of product development vs sales & marketing. Apple, for instance, does not provide line item detail on SG&A. Tesla, on the other hand, adds sales to product development. The mega-caps do not need to share as much, so they generally do not. Conglomerates generally are tough to measure this way due to sub-sector variation being so dramatic.
If there are others you want to add, let me know what you find. I restricted the list to get this result out to get feedback. The beauty of online writing is we can update with the results.
Identifying product rockets matters for builders
I was chatting with a VP of Product at a $100B+ market cap last week, and we worked our way to a conclusion we both felt strongly about – too many people assume product decisions of competitors are good decisions.
Product people need a tool to identify which competitors are actually growthing through product now. In this article, we have walked through one potential tool: the product rockets framework. By using the most recent quarter’s financials year over year revenue growth rate and ratio of product development to sales and marketing spend, we balance revenue and cost to come up with a qualitative product growth ranking. This provides at least some metrics behind company analysis. If a company keeps coming up in discussions, you can look up these metrics to see if it is actually growing through product.
Product rockets are the companies that all product people – product managers, founders, investors, product engineers, and product designers, to name a few – should study. These are the companies that define what it means to grow through product now.
Most of the lists and companies people look at are ancient. Take the Dropbox example. Every single article on the web writing about product growth talks about them; Dropbox had a freemium model. It still spends a lot on product development relative to sales and marketing. But it is not growing rocket-like compared to some other technology companies anymore. There are better examples to study.
As founders, product professionals, and investors, we want to find these better examples, these companies that grow through product. Here is one way we might. What do you think. Do you have a better way? The glory of internet writing is that we can iterate.
Next time
In the coming weeks, we will dive deeper into these companies to deconstruct how they grow through product. What gives the four rockets their edge? A lot of magic happens when you compare companies to those in their subsector, and tie product features to growth.
We will also be looking forward. These are the companies that have used product growth so far. As web3 unbundles the user, app, and database, new product rockets will emerge, and our conception of them may have to as well. Subscribe to join the ongoing analysis.
Note: These are just my thoughts, not my employer’s.
Thank you to Gad Allon, Terri Lonier, and Sachin Divecha for their feedback 🙏