In my 15 years as a product leader at companies from seed-stage to Google, I've seen one skill consistently separate the top 1% of Product Managers from the rest: ruthless, data-informed prioritization. It’s not about having the most ideas; it’s about executing the right ones at the right time. The market is littered with products that failed not due to a lack of features, but a lack of focus.
Aspiring PMs often believe their job is to build a roadmap. Senior PMs and product leaders know their job is to defend and execute the right roadmap, backed by a clear, defensible rationale. This means moving beyond gut feelings and stakeholder pressure to a systematic approach that aligns the entire organization, from engineering to sales, on what truly matters. Making the correct build-or-not-build decision is the highest-leverage activity a PM can perform, and a key differentiator in performance reviews that determine promotions and compensation, where top PMs at FAANG companies can earn well over $300,000 annually.
This guide isn't a theoretical overview. It’s a tactical playbook of 10 battle-tested product prioritization frameworks used by teams at Google, Meta, and high-growth startups to make high-stakes decisions. For each framework, we'll break down the 'how-to' with concrete examples, provide templates you can use tomorrow, and offer candid advice on when to use, and just as importantly, when to avoid each model. For AI PMs, we'll also include specific prompts you can use with tools like ChatGPT or Claude to accelerate your workflow. Let's dive in.
1. RICE Scoring
The RICE scoring model is a quantitative product prioritization framework that helps teams make data-driven, objective decisions. Popularized by the product team at Intercom, it removes subjective feelings from the roadmap planning process by forcing you to evaluate initiatives against four distinct, quantifiable factors. This framework is particularly effective when you need to compare dissimilar ideas, such as a new feature versus a performance improvement or a user acquisition experiment.
The RICE formula is: (Reach × Impact × Confidence) / Effort = RICE Score
Each component is scored independently, creating a standardized system for comparison.
How RICE Works: A Step-by-Step Breakdown
To implement this framework, you assign a numerical value to each of the four factors for every initiative on your list.
- Reach: How many users will this feature or initiative affect over a specific time period? (e.g., number of customers per quarter). Define this metric clearly and stick to it. Example: 1,500 users will encounter this new onboarding flow per month.
- Impact: What is the expected effect on those users? This is often the most subjective factor, so using a tiered scale helps maintain consistency.
- 3 = Massive impact (e.g., significantly increases conversion)
- 2 = High impact
- 1 = Medium impact
- 0.5 = Low impact
- 0.25 = Minimal impact
- Confidence: How sure are you about your Reach and Impact estimates? This score tempers enthusiasm with a dose of realism.
- 100% = High confidence (backed by quantitative data or user research)
- 80% = Medium confidence (supported by some data, but assumptions remain)
- 50% = Low confidence (a pure "gut feeling" or unverified idea)
- Effort: How much time will this require from your product, design, and engineering teams? Estimate this in "person-months" or a similar unit. Example: 2 engineers x 1 month + 1 designer x 0.5 months = 2.5 person-months.
Once calculated, the initiatives with the highest RICE scores float to the top of your priority list, providing a clear, defensible starting point for your roadmap.
AI PM Pro-Tip: Use a large language model to help standardize your scoring. Prompt for ChatGPT-4: "Act as a Senior Product Manager. Given the following feature idea: '[Describe feature]', and our goal of '[State goal, e.g., increase user activation]', help me formulate the Reach, Impact, Confidence, and Effort scores for a RICE analysis. Ask me clarifying questions about our user base, data, and engineering capacity to arrive at a defensible estimate." Learn more about how RICE scoring works with strategic frameworks.
2. MoSCoW Method
The MoSCoW method is a qualitative prioritization framework that helps teams reach a common understanding of what matters most in a specific release or time period. Developed by Dai Clegg at Oracle and popularized within the Dynamic Systems Development Method (DSDM), it's a simple yet powerful tool for aligning stakeholders and managing scope. Unlike quantitative models, MoSCoW focuses on categorization rather than granular scoring, making it ideal for release planning in Agile environments.
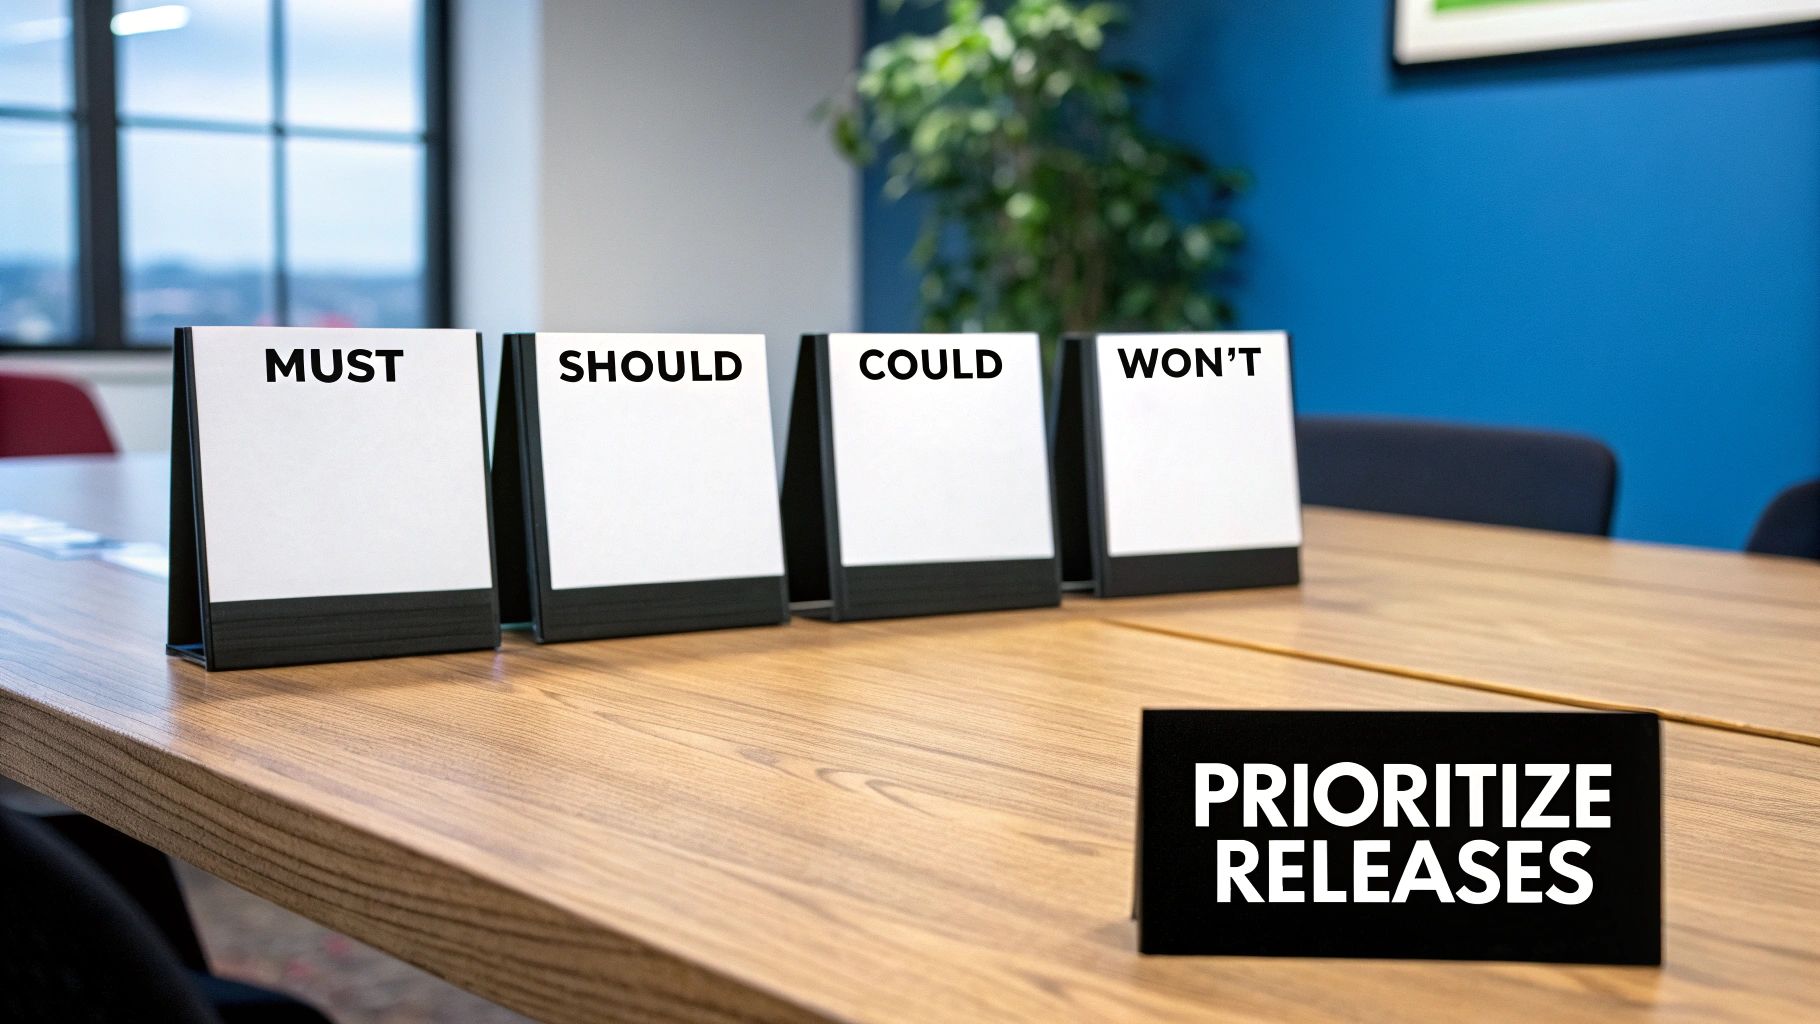
The acronym stands for Must have, Should have, Could have, and Won't have. This structure forces teams to make conscious trade-offs and define what is truly non-negotiable for success.
How MoSCoW Works: A Step-by-Step Breakdown
Implementation involves sorting features or initiatives into four distinct buckets. Establishing clear definitions for each category with your stakeholders is the critical first step.
- Must Have (M): These are non-negotiable requirements for the release. The product or feature is not viable without them. If even one "Must have" is not delivered, the release is considered a failure. Example: For an e-commerce checkout page, a "Pay Now" button is a Must have.
- Should Have (S): These initiatives are important but not vital for the current release. They provide significant value, but the product can still function and launch without them. These are often the first to be deprioritized if time or resources are constrained. Example: A "Guest Checkout" option is a Should have.
- Could Have (C): These are desirable "nice-to-have" features that will only be included if there is spare time and capacity. They have a smaller impact on the outcome and can easily be postponed to a future release. Example: The ability to save payment information for future purchases is a Could have.
- Won't Have (W): This category explicitly acknowledges items that are not being worked on in this release. This is crucial for managing stakeholder expectations and preventing scope creep. These items aren't abandoned forever; they are simply out of scope for now. Example: A "Subscription" feature Won't be in this initial launch.
By categorizing the backlog this way, teams gain immediate clarity on the release's core scope and where to focus their efforts, a foundational skill among effective product prioritization frameworks.
3. Kano Model
The Kano Model is a qualitative product prioritization framework that helps teams understand customer satisfaction by categorizing features based on their emotional impact. Developed in the 1980s by Professor Noriaki Kano, it shifts the focus from "what features should we build?" to "how will customers feel about these features?" This model helps teams prioritize features that not only meet basic needs but also delight and differentiate the product in a competitive market. It’s particularly useful for identifying high-value features that customers may not even know to ask for.
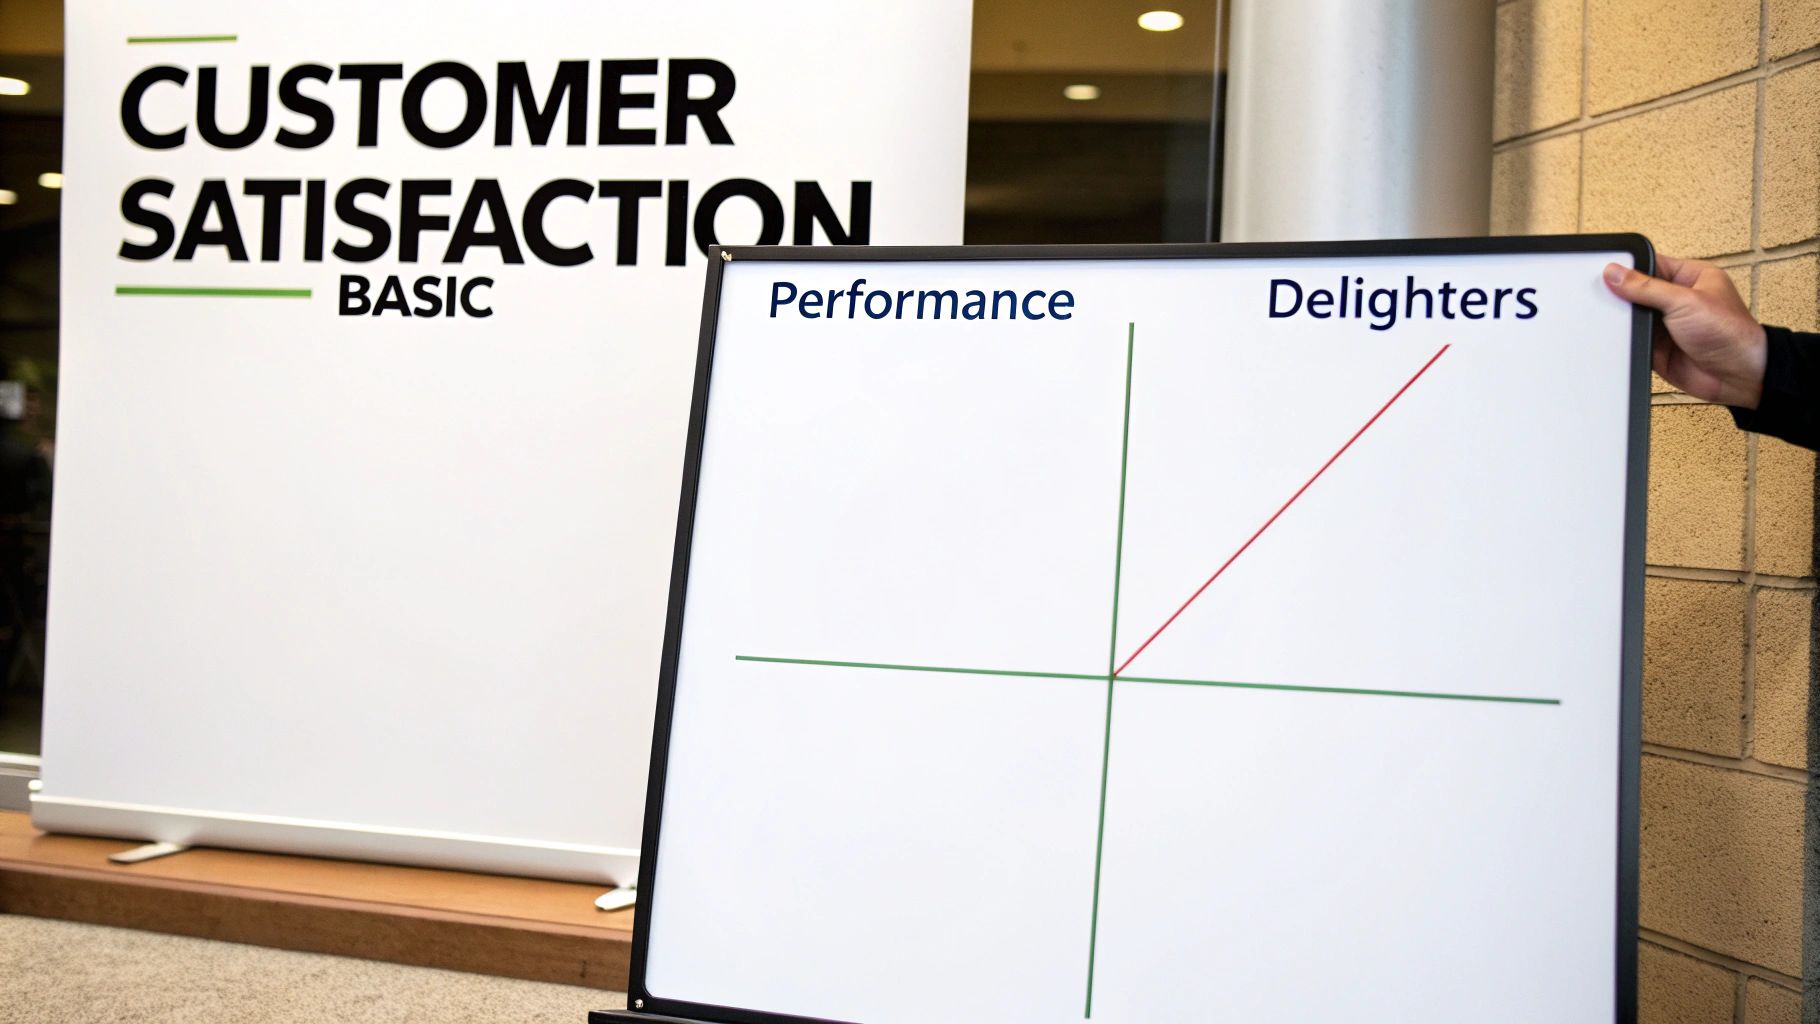
The model asserts that not all features are created equal; their absence or presence has a non-linear effect on customer satisfaction.
How the Kano Model Works: A Step-by-Step Breakdown
Implementation involves surveying customers to classify potential features into one of five categories, with three being most critical for prioritization.
- Basic (Must-be) Features: These are the expected, foundational features. If they are missing or poorly implemented, customers will be very dissatisfied. However, their presence doesn't increase satisfaction; it simply meets the minimum expectation. Example: The brakes on a new Tesla. You don't get excited that they work, but you'd be furious if they didn't.
- Performance (One-dimensional) Features: For these features, more is better. Customer satisfaction is directly proportional to their performance and quality. This is where you often compete with rivals. Example: A longer battery range in an electric vehicle or faster streaming quality on Netflix.
- Delighters (Attractive) Features: These are the unexpected, innovative features that create a "wow" moment. Their absence causes no dissatisfaction because customers don't expect them, but their presence can create significant delight and brand loyalty. Example: The "Dog Mode" in a Tesla, which was an unexpected but beloved addition for pet owners.
- Indifferent Features: Customers don't care whether these features are present or not.
- Reverse Features: The presence of these features actively causes dissatisfaction.
To classify features, teams use a specific questionnaire asking users how they would feel if a feature was present (functional) and if it was absent (dysfunctional). Based on the paired responses, each feature is categorized, giving you a clear guide on where to invest: ensure all Basics are covered, compete on Performance, and strategically introduce Delighters to stand out.
4. Value vs. Effort Matrix (2×2 Matrix)
The Value vs. Effort Matrix is a simple yet powerful visual product prioritization framework used to facilitate quick, collaborative decision-making. By plotting initiatives on a 2×2 grid, it forces teams to evaluate ideas based on two fundamental dimensions: the potential value they deliver and the effort required to implement them. This intuitive approach helps teams move beyond endless debate and rapidly identify the most logical sequence for their work, making it a staple in agile environments and strategic workshops.

This framework is particularly effective for aligning stakeholders and creating a shared understanding of priorities without getting bogged down in complex calculations.
How the Value vs. Effort Matrix Works: A Step-by-Step Breakdown
To use this framework, you visually map your potential initiatives into one of four quadrants, which then dictates the strategic approach.
- Define Your Axes: First, establish clear, shared definitions for "Value" and "Effort."
- Value (Vertical Axis): What does "value" mean for this project? It could be user acquisition, revenue growth, customer retention, or strategic alignment with company goals.
- Effort (Horizontal Axis): What constitutes "effort"? This typically includes development time, design resources, operational costs, and potential risks. Using a relative scale (like T-shirt sizes: S, M, L, XL) is often more effective than precise person-hours.
- Plot Your Initiatives: Collaboratively place each feature or project onto the matrix based on its estimated value and effort. This is best done as a team exercise to ensure buy-in.
- Categorize and Prioritize: Once plotted, initiatives fall into four distinct quadrants that guide your action plan:
- Quick Wins (High Value, Low Effort): These are your top priorities. Tackle them immediately to build momentum and deliver value quickly.
- Major Projects (High Value, High Effort): These are significant strategic initiatives. They require detailed planning and should be broken down into smaller phases.
- Fill-ins (Low Value, Low Effort): These are minor tasks or "nice-to-haves." Work on them when you have downtime or between major projects.
- Time Sinks (Low Value, High Effort): Avoid these. They consume significant resources for minimal return and should be deprioritized or discarded.
This quadrant-based system provides an instant visual guide for your product strategy. For a deeper dive into applying this and other methods, you can explore detailed guides on how to prioritize a roadmap to see how this visual framework fits into the larger planning process. Learn more about how to prioritize a roadmap effectively.
5. OKR (Objectives and Key Results)
The OKR framework aligns product prioritization directly with strategic business goals, ensuring that every feature and initiative serves a greater purpose. Instead of prioritizing a backlog in isolation, teams define ambitious, qualitative Objectives and measure progress toward them using specific, quantitative Key Results. This approach shifts the focus from output (shipping features) to outcomes (achieving measurable business impact), creating powerful alignment across the entire organization. It's one of the most effective product prioritization frameworks for connecting daily work to the company's North Star.
Prioritization becomes a question of: "Which initiative will make the biggest impact on our Key Results?" This forces a strategic conversation that moves beyond feature-level debates.
How OKRs Work: A Step-by-Step Breakdown
To implement OKRs, product teams collaborate with leadership to set goals that cascade from the company level down to the team level.
- Define the Objective: What is the high-level, aspirational goal you want to achieve? An Objective should be significant, concrete, action-oriented, and inspirational. It answers the question, "What do we want to accomplish?" Example Objective: "Launch a lovable V1 of our new AI-powered analytics tool to secure a foothold in the enterprise market."
- Establish Key Results: How will you measure progress toward that Objective? Key Results should be measurable, verifiable, and aggressive yet realistic. They answer the question, "How will we know if we've achieved our objective?"
- KR 1: Achieve a Net Promoter Score (NPS) of 40+ with our first 20 enterprise customers.
- KR 2: Increase the user activation rate for the new tool from 15% to 35%.
- KR 3: Generate $50k in new ARR from the AI analytics module this quarter.
- Prioritize Initiatives: With OKRs defined, you now evaluate all potential features, experiments, and tasks based on their direct contribution to moving these Key Results. If an idea doesn't clearly support a KR, it's deprioritized or discarded.
- Score and Track: Regularly review progress against your KRs throughout the quarter (weekly or bi-weekly). This constant feedback loop allows for agile adjustments, ensuring the team stays focused on what truly matters.
Initiatives that promise the most significant progress on your KRs are prioritized for the upcoming sprints. This creates a clear, defensible roadmap that everyone understands. To dive deeper into this topic, you can explore detailed guides on how and why OKRs work to drive product growth.
6. Weighted Scoring Model
The Weighted Scoring model is a highly adaptable and quantitative prioritization framework that allows teams to evaluate initiatives against a custom set of business-critical criteria. Instead of prescribing factors like RICE, it empowers product leaders to define what truly matters for their specific goals, such as strategic alignment, revenue impact, or technical risk. This makes it one of the most versatile product prioritization frameworks, ideal for organizations needing to balance diverse objectives and ensure roadmap decisions directly reflect strategic priorities.
The formula is a sum of scores multiplied by their weights: (Criterion A Score × Criterion A Weight) + (Criterion B Score × Criterion B Weight) + … = Total Score
Each initiative is evaluated against the same criteria, producing a ranked list that transparently reflects business values.
How Weighted Scoring Works: A Step-by-Step Breakdown
To implement this framework, your team first defines the criteria and their relative importance, then scores each potential project.
-
Define Your Criteria: Collaborate with stakeholders to select 5-7 criteria that represent your strategic goals. Examples include:
- Strategic Fit: How well does this align with our quarterly OKRs?
- Revenue Impact: What is the potential to increase monthly recurring revenue?
- User Value: How much will this improve the user experience or solve a key pain point?
- Development Effort: How complex is the implementation for engineering?
- Market Differentiation: Does this create a competitive advantage?
-
Assign Weights: Distribute 100 percentage points across your chosen criteria based on their current importance to the business. A criterion like Strategic Fit might get a weight of 30%, while Market Differentiation might be 15%.
-
Establish a Scoring Scale: Use a consistent scale, such as 1 to 5, to score each initiative against every criterion. Clearly define what each number means (e.g., for User Value, 1 = Minor convenience, 5 = Solves a critical, daily problem).
-
Calculate the Total Score: For each initiative, multiply the score for each criterion by its assigned weight. Sum these totals to get the final weighted score.
Initiatives with the highest scores are the highest priority. This method is common in large enterprises like Microsoft and IBM for portfolio management, where balancing a wide range of factors is crucial for making defensible, data-informed decisions.
7. Jobs to be Done (JTBD)
The Jobs to be Done (JTBD) framework shifts the focus of product prioritization from features and user demographics to the core "job" a customer is trying to accomplish. Popularized by Clayton Christensen, this approach argues that customers "hire" products to get a specific job done. By deeply understanding this underlying motivation, teams can prioritize initiatives that truly solve the customer's core problem, leading to more meaningful innovation and stronger market fit. This is one of the most powerful qualitative product prioritization frameworks for uncovering what customers truly value.
JTBD reframes the entire product development process. Instead of asking "What features should we build?" it asks, "What progress is the customer trying to make?" Answering this question helps teams prioritize solutions that help customers achieve their desired outcomes more effectively than any competing alternative. For example, Netflix was hired for the job of "convenient entertainment," which allowed it to evolve from DVDs by mail to streaming.
How JTBD Works: A Step-by-Step Breakdown
Implementing JTBD is a process of deep customer discovery that informs your roadmap. The goal is to identify underserved outcomes related to a specific job.
- Define the "Job": Identify the core functional and emotional task the customer is trying to accomplish. This requires qualitative research, such as customer interviews and observation. Ask "why" multiple times to move beyond surface-level needs. Example: A B2B software user's job isn't just to "generate a report," but to "look prepared and competent in a high-stakes executive meeting."
- Map the Job Steps: Break down the core job into a sequence of steps the customer takes to complete it. This reveals pain points and opportunities for improvement at each stage.
- Uncover Desired Outcomes: For each step, identify the metrics customers use to measure success. These are their desired outcomes. They are typically framed as [direction of improvement] + [metric] + [object of control]. Example: "Minimize the time it takes to find the right data for the report."
- Prioritize Opportunities: Survey customers to score each desired outcome on its importance and their current satisfaction with existing solutions. The opportunities with high importance and low satisfaction are your top priorities for innovation.
By focusing on these underserved outcomes, you can confidently prioritize features and improvements that directly help customers get their job done better. You can find templates and guides to help structure these customer interviews and opportunity scoring. Learn more about applying the Jobs to be Done framework with a template.
8. Impact vs. Confidence Matrix
The Impact vs. Confidence Matrix is a strategic product prioritization framework that helps teams visualize and categorize initiatives based on their potential value and the certainty of that value. Unlike purely quantitative models, this matrix explicitly addresses uncertainty, making it a powerful tool for balancing sure wins against high-risk, high-reward bets. It forces teams to confront the question: "How sure are we that this idea will deliver the impact we think it will?"
This framework is especially valuable for portfolio management, corporate innovation programs exploring new markets, or any situation where you need to decide between optimizing existing products and exploring brand-new opportunities. It visually separates ideas into four distinct quadrants, guiding strategic decisions on where to invest, where to research further, and what to discard.
How the Impact vs. Confidence Matrix Works: A Step-by-Step Breakdown
To use this framework, you plot each potential initiative on a 2×2 grid, with business impact on the vertical axis and confidence on the horizontal axis.
- Estimate Impact: Assess the potential value this initiative could deliver to the business or users. This is often qualitative and categorized on a simple scale.
- High Impact: A game-changer that could significantly move key metrics (e.g., revenue, market share, user engagement).
- Low Impact: An incremental improvement or minor optimization.
- Estimate Confidence: Evaluate how certain you are about your Impact assessment. This is a measure of the evidence you have.
- High Confidence: Supported by strong quantitative data, direct user research, or results from past experiments.
- Low Confidence: Based on a gut feeling, an assumption, or limited anecdotal evidence.
- Plot on the Matrix: Place each initiative into one of four quadrants based on its scores.
- High Impact / High Confidence (Big Bets): These are your top priorities. Execute these with conviction as they promise significant, reliable returns.
- High Impact / Low Confidence (Research & Experiment): These are potential game-changers but require more validation. Prioritize discovery work, prototyping, or small-scale experiments to increase confidence before committing fully.
- Low Impact / High Confidence (Quick Wins): These are incremental improvements that are easy to justify and implement. They are great for filling roadmap gaps but shouldn't distract from bigger goals.
- Low Impact / Low Confidence (Re-evaluate or Discard): These are time-wasters. Avoid them unless new information emerges that drastically changes their potential impact or your confidence level.
By categorizing initiatives this way, teams gain a clear, strategic overview, enabling smarter resource allocation between executing knowns and exploring unknowns.
9. Opportunity Scoring
Opportunity Scoring is a customer-centric prioritization framework that shifts the focus from internal ideas to external user needs. Originating from Anthony Ulwick’s Jobs to be Done (JTBD) theory, this model helps product teams identify and prioritize features based on where the biggest gaps exist between how important a need is to a customer and how satisfied they currently are with existing solutions. This makes it one of the most powerful product prioritization frameworks for innovation and entering competitive markets.
The Opportunity Scoring formula is: Importance + (Importance – Satisfaction) = Opportunity Score
This calculation highlights "jobs" or outcomes that are both highly important and poorly served, pinpointing areas ripe for improvement.
How Opportunity Scoring Works: A Step-by-Step Breakdown
To implement this framework, you gather quantitative data directly from your target market through surveys.
- Identify Customer Outcomes: First, define the key "jobs" or outcomes your customers are trying to achieve with your product or a competitor's. These should be specific and measurable. Example: "Minimize the time it takes to generate a monthly report."
- Survey Customers on Importance: Ask a statistically significant group of users to rate the importance of each outcome on a scale, typically 1 to 5.
- 5 = Critically Important
- 4 = Very Important
- 3 = Moderately Important
- 2 = Slightly Important
- 1 = Not at all Important
- Survey Customers on Satisfaction: Next, ask the same group to rate their current satisfaction with how well they can achieve that outcome using existing solutions (yours or others), again on a 1-to-5 scale.
- 5 = Very Satisfied
- 4 = Satisfied
- 3 = Neither Satisfied nor Dissatisfied
- 2 = Dissatisfied
- 1 = Very Dissatisfied
- Calculate the Opportunity Score: For each outcome, calculate the average Importance and Satisfaction scores from all respondents. Plug these averages into the formula. Example: If "generate a monthly report" has an average Importance of 4.5 and an average Satisfaction of 2.5, the score is 4.5 + (4.5 – 2.5) = 6.5.
Outcomes with the highest scores represent underserved needs and become top priorities for your roadmap. This data-driven approach is a cornerstone of effective product discovery. To see how this fits into a broader strategy, you can learn more about the product discovery process.
10. Stack Ranking (Forced Ranking)
Stack Ranking, also known as forced ranking, is a comparative prioritization framework that forces a strict, relative order among initiatives. Instead of assigning independent scores like RICE or MoSCoW, team members rank items directly against each other, creating a clear sequence from first to last. This method is exceptionally effective at preventing "priority inflation," where every initiative is deemed high-importance, and forces the tough conversations needed to create a single, focused backlog.
While sometimes controversial for its use in performance reviews, its application in product management provides clarity. It compels teams to make definitive choices, which is invaluable when resources are limited and every decision has a significant opportunity cost. Companies like Microsoft have historically used variations of this method to make hard calls on feature development, ensuring engineering efforts are concentrated on what is truly most critical.
How Stack Ranking Works: A Step-by-Step Breakdown
The core of this framework is the process of direct comparison. The goal is not to know an item's absolute value, but its value relative to everything else.
- Establish Clear Criteria: Before ranking, the team must agree on the primary criteria for prioritization. Is the goal to drive user acquisition, increase retention, or reduce technical debt? Define the "winning" condition (e.g., "the feature most likely to increase our Q3 retention goal").
- List All Initiatives: Gather all potential features, epics, or projects into a single, visible list.
- Rank Independently: Each stakeholder or team member ranks the entire list from most important (#1) to least important (#N) based on the agreed-upon criteria. This initial, independent ranking prevents groupthink.
- Consolidate and Discuss: Collect all the individual rankings. A simple way to do this is to average the ranks for each item. The most crucial step is to facilitate a discussion around major discrepancies. Why did the lead engineer rank "Refactor Billing Service" as #2 while the product marketer ranked it #15?
- Finalize the Ranked List: Through moderated discussion and debate, the team collaborates to create a single, unified ranked list. This becomes the definitive priority order for the product roadmap. For large lists, a pairwise comparison (pitting two items against each other in a tournament style) can simplify the process.
Top 10 Product Prioritization Frameworks Comparison
| Framework | 🔄 Implementation complexity | ⚡ Resource requirements | ⭐ Expected outcomes | 📊 Ideal use cases | Key advantages & tips 💡 |
|---|---|---|---|---|---|
| RICE Scoring | Medium — simple formula but needs calibration | Moderate — requires data estimates (reach/impact/confidence) | Clear, comparable numerical ranking ⭐⭐ | Backlog ranking across many features | Reduces subjective bias; define reach/impact scales and calibrate confidence |
| MoSCoW Method | Low — categorical sorting | Low — minimal data, stakeholder discussion | Clear scope boundaries; less precision ⭐ | Release planning, time-boxed sprints | Easy to communicate; set strict "Must" criteria and review "Won't have" regularly |
| Kano Model | Medium–High — needs customer research | High — interviews/surveys for classification | Strong customer satisfaction insight ⭐⭐⭐ | Feature discovery, differentiation, UX strategy | Reveals delighters vs basics; use functional/dysfunctional questions |
| Value vs. Effort Matrix | Low — visual plotting, simple to adopt | Low–Moderate — quick estimates suffice | Fast visual prioritization; less granularity ⭐ | Workshops, quick prioritization, identifying quick wins | Intuitive for teams; define value/effort scales and revisit often |
| OKR (Objectives & Key Results) | High — requires strategic alignment and cadence | High — planning, tracking, cross-team coordination | Strong strategic alignment and measurable outcomes ⭐⭐⭐ | Aligning roadmaps to company goals, quarterly planning | Focus outcomes not outputs; limit objectives and make KRs measurable |
| Weighted Scoring Model | High — design criteria and weights carefully | Moderate–High — scoring effort and data collection | Balanced multi-criteria ranking; defensible results ⭐⭐ | Portfolio decisions, regulated environments | Customizable and transparent; start with 5–7 criteria and document definitions |
| Jobs to be Done (JTBD) | High — deep qualitative research and synthesis | High — ethnographic interviews and analysis | Deep customer-centric insights; better product-market fit ⭐⭐⭐ | Strategic product discovery and positioning | Prioritize based on customer outcomes; map job steps and emotional jobs |
| Impact vs. Confidence Matrix | Medium — plotting with evidence-based confidence | Moderate — requires impact estimates and evidence | Highlights uncertainty and research priorities ⭐⭐ | Portfolio management, deciding research vs build bets | Use to balance proven wins vs exploratory bets; collect evidence to raise confidence |
| Opportunity Scoring | High — requires systematic customer surveys | High — importance/satisfaction research per segment | Identifies unmet needs with high potential ⭐⭐⭐ | New product opportunities, competitive gaps | Focus on top opportunities; pair with effort assessment for feasibility |
| Stack Ranking (Forced Ranking) | Medium — process-driven but can be contentious | Low–Moderate — requires time for comparisons | Clear strict order; lacks magnitude context ⭐ | Limited capacity environments, final cut decisions | Prevents score inflation; use pairwise rounds and document rationale |
From Frameworks to Action: Building Your Prioritization System
You've just navigated a comprehensive arsenal of product prioritization frameworks, from the mathematical precision of RICE to the customer-centric empathy of the Kano Model. The common thread connecting all ten methodologies is not about finding a single, perfect tool, but about building a repeatable, defensible system for making difficult decisions. As a Product Manager, your ability to articulate the "why" behind your roadmap is just as crucial as the roadmap itself. These frameworks are your toolkit for constructing that narrative with clarity and conviction.
Merely knowing these frameworks is the entry-level expectation. The real career differentiator, the skill that separates a junior PM from a senior product leader at a company like Google or Meta, is the ability to synthesize, adapt, and evangelize a hybrid prioritization system. No single framework is a silver bullet. The market is too dynamic, stakeholder needs are too diverse, and engineering capacity is too finite for a one-size-fits-all approach. The most effective leaders create a custom-fit process that blends the objective with the subjective, the quantitative with the qualitative.
Creating Your Hybrid Prioritization Engine
Your immediate next step is to move from theory to practice. Don't try to implement all ten frameworks at once. Instead, build your own "prioritization stack" by selecting two complementary models to start with.
-
Choose Your Qualitative Lens: Start with a framework focused on discovery and customer understanding. This is how you source and define potential opportunities.
- Kano Model: Ideal for understanding how features drive customer delight versus just meeting basic expectations.
- Jobs to be Done (JTBD): Perfect for uncovering the core motivations behind user actions, leading to more innovative solutions.
-
Select Your Quantitative Filter: Once you have a pool of validated ideas, use a quantitative framework to stack rank them based on strategic value. This is how you justify your roadmap to leadership and engineering.
- RICE Scoring: Excellent for teams that need to balance reach, impact, and effort with a confidence score. It’s a standard for a reason.
- Weighted Scoring: The most adaptable model. It allows you to create a formula that perfectly reflects your company’s unique strategic goals, whether it’s user acquisition, revenue growth, or technical debt reduction.
By combining a qualitative lens (like JTBD) with a quantitative filter (like a custom Weighted Scoring model), you create a powerful, two-stage system. You ensure you're solving the right problems for your users, and then you sequence those solutions to deliver the most value to the business.
From System to Execution
A well-defined system is useless without rigorous execution. Once your priorities are set, the focus must shift to implementation and tracking. This transition from strategic decision-making to tactical execution is where many teams falter. A clear framework demands an equally clear workflow. To maintain momentum and transparency, your prioritized initiatives must be translated into actionable tasks within a centralized system. Utilizing effective task management solutions is critical for organizing sprints, assigning ownership, and tracking progress against the very goals your framework helped you define.
Ultimately, mastering product prioritization frameworks is about more than just organizing a backlog; it’s about building influence. It's about transforming chaotic feature requests and competing stakeholder demands into a clear, strategic roadmap that everyone can understand and rally behind. It’s the muscle that, when developed, will enable you to confidently say "no" to good ideas in order to say "yes" to the great ones, driving meaningful outcomes for your customers and accelerating your career trajectory.
For deeper insights and weekly advice on navigating the complexities of product leadership, from prioritization to career growth, consider following the work of Aakash Gupta. His newsletter provides tactical frameworks and industry analysis trusted by PMs at top tech companies worldwide. Explore his thought leadership at Aakash Gupta.
