Most advice on product metrics is backwards. It tells PMs to instrument everything, build a dashboard, and let the data speak. In practice, the data rarely speaks. It mumbles. Then a team fills the silence with opinions, politics, and whichever chart makes the roadmap look justified.
The PMs who get promoted don't win because they tracked more numbers. They win because they picked the metric that matters, tied it to a business decision, and used it to move the room. That's the difference between a PM who reports and a PM who leads.
You can see the shift in how people think about measurement more broadly. The authors of Metrics That Matter argue that many common metrics are “confusing, misleading,” and that the useful ones are the ones that change behavior or improve outcomes, as discussed in this conversation about Metrics That Matter. Product leadership has been moving the same way for years. Google, Meta, and strong startup teams don't reward PMs for producing a thicker dashboard. They reward PMs who know which metric should drive the next decision.
That's also why metrics are a career skill, not just an analytics skill. Mid-career PMs often stall because they stay too close to output. Senior PMs achieve impact by framing the business in a small set of metrics, separating what's merely measured from what matters. If you need a clean refresher on that distinction, Aakash Gupta's breakdown of KPI vs metric is worth reviewing before your next planning cycle.
Why Most Metrics Are a Waste of Time
A lot of PMs spend hours grooming dashboards that never change a decision. That work feels rigorous. It rarely changes product outcomes, and it does not build the kind of judgment that gets you promoted.
A metric earns its place when it helps a team choose between real options. Ship now or hold. Fix onboarding or invest in acquisition. Push pricing or protect retention. If a number does not change prioritization, resource allocation, or executive confidence, it is reporting overhead.
Reporting is not management
A common failure mode is treating metrics as a weekly reporting exercise instead of a decision system. Teams pull whatever the analytics tool makes easy to display. Traffic, clicks, opens, sign-ups, feature usage. The list grows because no one wants to remove a chart that might matter later.
That is how dashboards turn into political artifacts. Every function finds a number that makes its work look productive. Product reviews become tours of activity instead of discussions about trade-offs, risk, and next moves.
Most PM dashboards don't have a data problem. They have a decision problem.
The practical test is simple. Before a metric goes on your dashboard, define who will act on it, what decision it informs, and what action becomes more likely if it moves. If you cannot answer those three questions, leave it out.
This matters in day-to-day product work. Total sign-ups can rise while activation stays weak. Feature opens can increase while retention slips. Revenue can hold for a quarter while trust erodes underneath. PMs who miss those tensions end up defending output while the product gets worse.
If you need a cleaner distinction between general reporting and metrics tied to business goals, Aakash Gupta's explanation of the difference between a KPI and a metric is a useful reference.
The promotion angle most PMs miss
Metric selection is not a hygiene skill. It is a leadership skill.
Senior leaders use metrics to compress complexity. They want to know what matters, what changed, why it changed, and what you recommend. At Google, Meta, and high-growth startups, the PM who gains trust is usually the one who can reduce a messy situation to a few defensible measures without hiding the downside.
That has direct career consequences. Junior PMs often bring updates. Senior PMs frame decisions. Staff-level product leaders use metrics to manage up. They walk into a review with a clear story: this is the behavior we need to change, this is the leading signal, this is the business risk if we are wrong, and this is the trade-off behind my recommendation.
That kind of clarity affects scope, visibility, and compensation. Leaders remember the PM who makes the room sharper.
Use this test on any metric you plan to champion:
- If it goes up, does user value likely improve?
- If it drops, is it clear which team should respond?
- If it changes, can you explain the driver in plain English?
- If it stays flat for two quarters, would you change the roadmap or keep investing?
If those answers are fuzzy, the metric is probably too far from the actual decision.
Good PMs know the numbers. Promotable PMs know which number matters, when it matters, and how to use it to align leadership before the roadmap review starts.
The Three Essential PM Metric Frameworks
Frameworks matter because they stop you from choosing metrics based on whatever your analytics tool happens to expose first. Good PMs use frameworks the way good operators use maps. Not because the map is perfect, but because wandering is worse.
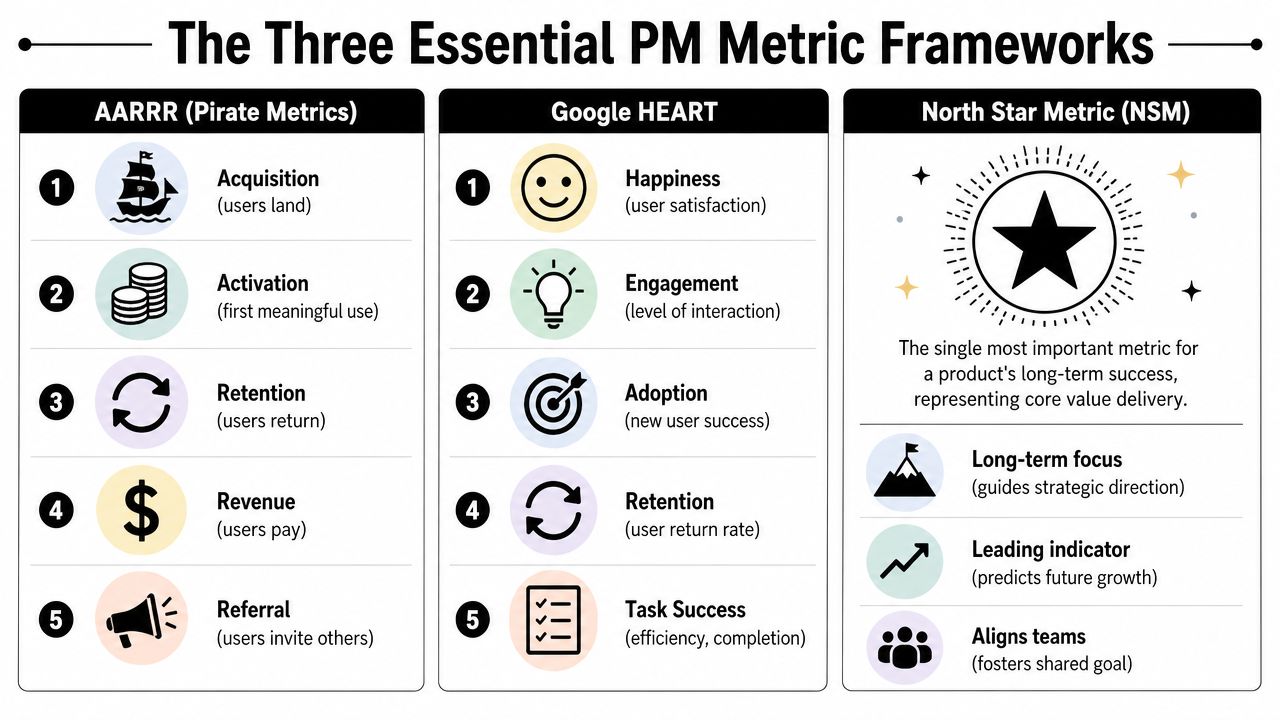
AARRR for growth and funnel diagnosis
If you're working on a user journey with clear stages, AARRR is still one of the most practical frameworks. The core families are acquisition, activation, engagement, retention, and monetization, and they're widely used because they connect user activity to strategic goals instead of just raw clicks, as outlined in Amplitude's guide to product metrics and AARRR.
This is the right lens when your team is trying to answer questions like:
- Where is the funnel leaking?
- Are we getting users but failing to activate them?
- Are users activating but not coming back?
- Is monetization weak for a specific cohort or segment?
For startups, this framework forces discipline. A seed-stage company often thinks it has a top-of-funnel problem when it instead has an activation problem. A later-stage growth team often assumes retention is solved because usage exists, but engagement depth may be shallow.
AARRR is operational. That's its strength. It's less useful when the product is mature and user experience quality is the main concern.
HEART for mature products and experience quality
Google's HEART framework is useful when the hard question isn't “where is the funnel broken?” but “is the product experience getting better for users?” It's better suited to mature surfaces, internal products, and platform experiences where friction, satisfaction, and task completion matter as much as raw conversion.
HEART pushes teams toward experience quality through categories like happiness, engagement, adoption, retention, and task success. If you own an established collaboration tool, enterprise workflow, or consumer surface with repeat usage, HEART gives you a more balanced way to evaluate the product than a pure growth lens.
Many mid-career PMs advance by gaining deeper insight into metrics. Junior PMs often default to funnel metrics because they're easy to pull. Senior PMs know that a mature product can hit its funnel targets while still frustrating users.
Practical rule: Use AARRR when you're debugging movement through a journey. Use HEART when you're judging the quality of the experience itself.
North Star for alignment and executive clarity
A North Star Metric is the single metric that best reflects long-term value delivery. It's not just a dashboard artifact. It's an alignment tool. Used well, it helps growth, product, design, engineering, and go-to-market teams pull in the same direction.
The mistake is treating a North Star like a slogan. If a metric can't influence roadmap trade-offs, team goals, or resourcing decisions, it isn't functioning as a North Star. It's branding.
For teams trying to build this discipline, Aakash Gupta's primer on the North Star metric is useful because it grounds the concept in product decisions rather than theory.
A simple comparison helps:
| Framework | Best used when | What it helps you decide |
|---|---|---|
| AARRR | You need to locate growth friction in a user journey | Which funnel stage deserves focus |
| HEART | You need to evaluate experience quality in a mature product | Whether users are actually succeeding and satisfied |
| North Star | You need cross-functional alignment around long-term value | What the company should optimize toward |
If you work at a high-growth startup, you'll probably use all three at different levels. The trap is trying to make one framework do every job.
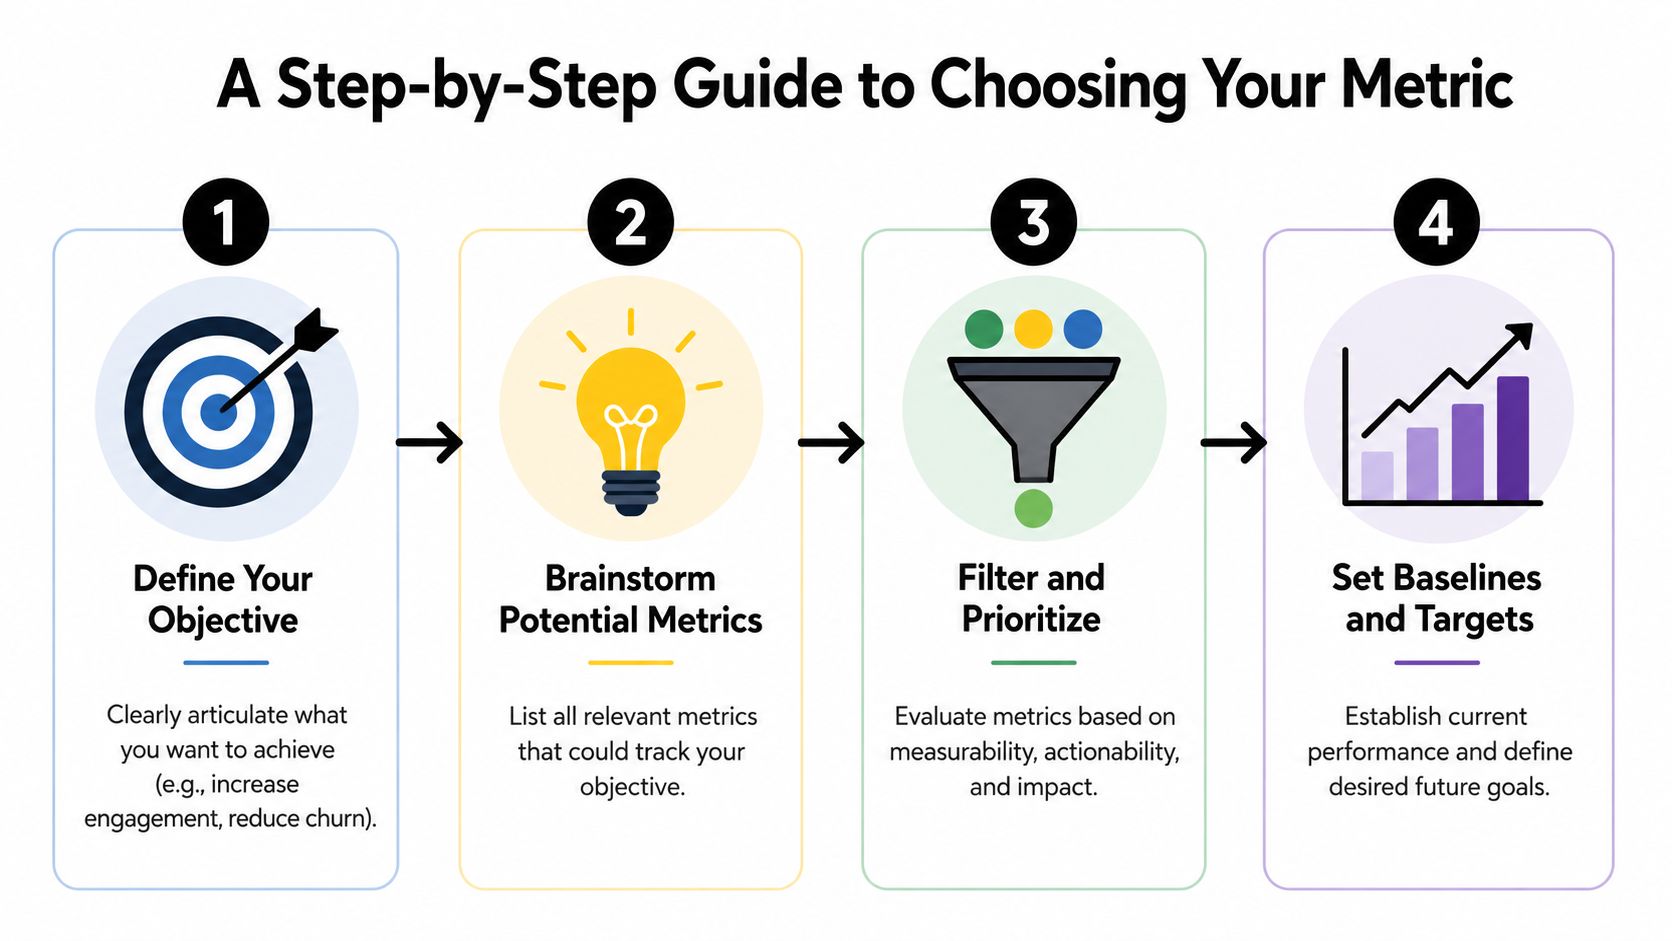
A Step-by-Step Guide to Choosing Your Metric
Most PMs don't struggle because they lack possible metrics. They struggle because they have too many. The fix isn't another dashboard. It's a decision process.
Start with the objective, not the data
The cleanest best practice is to separate metrics from KPIs. Metrics are measurements. KPIs are the subset tied directly to strategic goals. Teams should define SMART objectives first, then choose leading and lagging indicators so they can act before outcomes fully materialize, as explained in this guide to business metrics and KPI selection.
That means your first move is not “what can we measure?” It's “what are we trying to change?”
Here's a practical sequence I use with PMs:
Name the business objective
Increase successful onboarding. Improve repeat usage. Reduce churn risk in a key segment. Expand monetization quality, not just revenue volume.Map the user journey
Identify the point where users first receive real value. Then trace the behaviors that typically happen before repeat value appears.Find the main bottleneck
Don't spread attention across every weak area. Choose the current constraint that is most limiting progress.Select one leading metric
Pick the signal that will move before the business outcome fully shows up.
If you want a practical growth lens for this exercise, Aakash Gupta's thinking on a framework for growth is useful because it pushes teams to connect metrics to the actual growth loop.
Filter candidate metrics like a senior PM
A strong candidate metric should pass four filters:
- Actionable: A team can change it through product, lifecycle, pricing, or UX decisions.
- Causal enough: It has a believable relationship to the outcome you care about.
- Timely: It moves fast enough to support learning.
- Hard to fake: Teams can't game it without creating visible user harm.
That last point matters more than most PMs think. A bad metric invites local optimization. A good metric forces user value.
For inspiration, it can help to review real community projects on product metrics and see how different products frame their core signals across categories and business models.
A fintech example makes this concrete. Suppose the business goal is to increase long-term investing activity. Total app opens won't help much. Even successful account creation may be too early. A stronger candidate might focus on repeat investment behavior after the first funded action, because that's closer to durable value and future monetization.
Use both a document and a conversation
A metric choice should be written down before it's socialized. I like a one-page spec with:
- Objective
- Chosen KPI
- Why this metric matters now
- What leading signals support it
- What would cause us to change it
- What decisions this metric should influence
Then bring it to a review.
This short video is a useful companion if you want another take on structuring the metric selection process:
The PMs who manage up well don't show executives a metric and ask for validation. They frame the trade-off first, then present the metric as the clearest lens for making the next decision.
Metrics for Different Product Stages and PM Roles
The right metric changes with the product and with the job. That's where generic advice breaks down. A seed-stage consumer app, an enterprise platform, and an AI assistant should not be measured the same way, even if they share the same analytics tool.
Product stage changes what “good” looks like
Early-stage teams often overvalue acquisition because it's visible. Mature teams often overvalue monetization because finance watches it closely. Both can miss the product's real constraint.
For engagement-heavy products, one useful benchmark is that a DAU/MAU ratio of 0.2 or higher is commonly used as a sign of healthy retention because it approximates how frequently monthly users return, according to Quantum Metric's overview of key product analytics metrics. That doesn't mean every product should chase it. It means benchmark logic should match product behavior.
A meditation app, messaging product, and procurement workflow tool each have different expected usage rhythms. Senior PMs know this. Junior PMs often import the wrong benchmark and call it strategy.
PM Metrics by Role and Stage
| Role / Stage | Primary Metric Focus | Example Metric |
|---|---|---|
| Discovery stage PM | Problem validation and repeat value | Users returning after first meaningful experience |
| Growth PM | Funnel movement at the current bottleneck | Activation completion or repeat engaged users |
| Retention PM | Habit strength and cohort durability | Returning users by cohort over time |
| Platform PM | Adoption and reliability of core capabilities | Active internal teams using a platform capability |
| Monetization PM | Revenue quality and value capture | Expansion behavior or recurring revenue signal |
| AI PM | Task success, trust, and repeat use | Successful task completion with user acceptance |
| Mature product PM | Depth of engagement and workflow lock-in | Frequency of high-value actions among active users |
For monetization PMs, especially in SaaS, recurring revenue concepts matter because they help distinguish one-time spikes from durable business value. If you need a straightforward business-side refresher, Fundl has a solid explainer on what recurring revenue means.
Role-specific judgment is what gets noticed
A Growth PM at a marketplace usually cares less about raw traffic and more about liquidity, matching, and repeat transactions. A Platform PM often needs to prove that internal teams adopt the platform because it reduces friction, not because leadership mandated usage. An AI PM has an even harder job. Clean usage numbers can look healthy while trust erodes.
That's why AI PMs need a broader lens. Measure whether the user completed the task, whether they accepted the output, whether they came back, and whether they escalated to a human workaround. If you only track usage, you'll miss the difference between novelty and utility.
For retention work, cohort thinking matters more than aggregate charts. Aakash Gupta's guide on what cohort analysis is is a practical place to sharpen that skill, especially if your retention debates keep getting derailed by blended averages.
A PM's maturity shows up in whether they choose metrics that fit the product's stage, not the metrics they saw in someone else's case study.
Dangerous Anti-Patterns That Kill Products
A bad metric doesn't just create confusion. It creates bad behavior. Teams start optimizing the chart instead of the product, and the damage usually looks rational while it's happening.
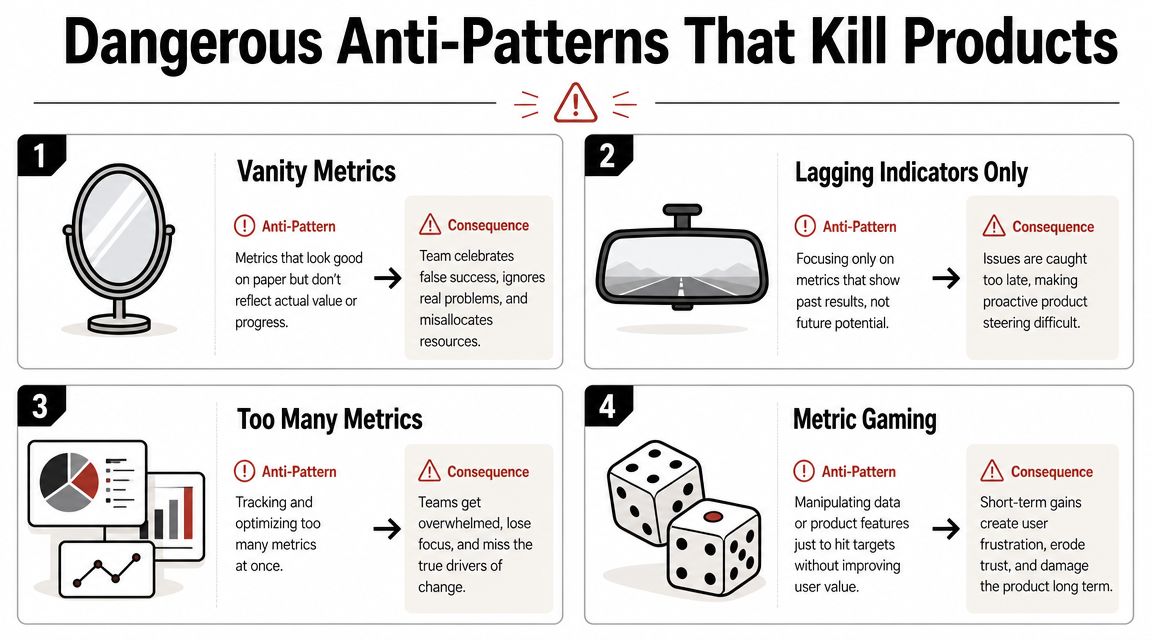
Vanity metrics create false confidence
Page views, raw installs, feature opens, and total registered users are seductive because they rise easily. They also let a PM tell a positive story without proving value.
That's why I push teams to classify signals into three buckets:
- Vanity metrics: Numbers that look impressive but don't prove user value.
- Proxy metrics: Imperfect but useful indicators that may predict an outcome.
- Progress metrics: Signals that show movement toward a strategic goal.
This distinction matters because some of the most important signals don't even sit neatly on a dashboard. Creator commentary has argued that replies, direct messages, saves, referrals, and whether attention led to an actual next step can be more diagnostic than a clean conversion chart, as discussed in this video on quiet but meaningful progress signals.
A PM who ignores those signals can miss a failing product until the lagging numbers finally catch up.
Lagging-only management makes teams slow
Quarterly revenue, closed deals, and churn are important. They're also often too late for day-to-day product steering.
If your weekly product review only looks at lagging outcomes, the team will spend most of its time explaining the past. That's not management. That's postmortem theater.
Use a simple pairing:
| If the business cares about | Also track a leading signal like |
|---|---|
| Revenue quality | Repeat usage among the cohort most likely to convert |
| Retention | Early behaviors that correlate with return value |
| Expansion | Adoption depth of the capability tied to upsell |
| Trust | User acceptance, complaints, and support themes |
Metric gaming is always closer than you think
When a metric becomes a target without guardrails, teams will eventually distort behavior to hit it. That might mean aggressive notifications to inflate engagement, forced funnels to improve conversion, or low-quality AI outputs that appear to increase task completion.
A fast stress test helps:
- Can this metric rise while user trust falls?
- Can we hit this goal by making the experience more annoying?
- Would a PM feel pressure to hide context when presenting it upward?
- Would design or support disagree that this reflects user value?
If the answer is yes, your metric needs a counterbalance.
The fastest way to damage a product is to reward a team for moving a number that users don't actually care about.
Google and Meta both understand this at scale. Teams don't survive long by shipping metric theater. But startups are especially vulnerable because they need momentum and often accept flattering signals too easily. Don't be that PM.
Your Measurement Stack and Dashboard Best Practices
The metric that matters is only useful if the team can trust how it's captured and understand it in under a minute. Bad instrumentation creates fake debates. Bad dashboards create fake alignment.
Choose tools based on decisions, not logos
You don't need an enterprise stack to start. You do need enough discipline to instrument events consistently and inspect behavior by segment and cohort.
A practical breakdown looks like this:
- PostHog: Good for startups and product-led teams that want flexibility, event tracking, feature flags, and session-level analysis without a heavy buying cycle.
- Mixpanel: Strong for self-serve analytics, funnel work, retention analysis, and PM-owned exploration.
- Amplitude: Well suited to mature product orgs that need strong governance, standardized taxonomy, and broader cross-functional reporting.
- Looker or Mode: Useful when the product metric that matters needs to be joined with sales, finance, or warehouse data.
- Session replay tools: Valuable when a number moves and the team needs behavioral context, not just a chart.
If you're mapping how these systems fit together across product, data, and reporting layers, this simple tech stack diagram helps clarify ownership boundaries.
Write an instrumentation spec engineers won't hate
Most instrumentation docs are either too vague or too bloated. Keep it tight.
Use a one-page template:
| Field | What to include |
|---|---|
| Event name | Clear, stable naming convention |
| Trigger | Exactly when the event fires |
| Properties | Context fields that matter for analysis |
| Exclusions | What should not fire the event |
| Owner | PM or analyst responsible for definition |
| Why it matters | The decision this event supports |
This does two things. First, it saves engineering time. Second, it forces the PM to justify why an event exists.
Build dashboards for different audiences
Your team dashboard and your leadership dashboard should not be the same.
For the product squad, include diagnostic views. Funnel breakdowns, cohorts, experiment reads, and recent movement by segment are all fair game. For leadership, keep it narrow. One page. Trend lines, context, and a short annotation on what changed and what action follows.
A useful operating rule is this: every chart should answer one of three questions.
- What changed
- Why it changed
- What we're doing next
If a chart answers none of those, remove it.
One non-tool resource that can help PMs sharpen this muscle is Aakash Gupta's newsletter and podcast. It's a content resource, not a measurement platform, but it's useful for seeing how experienced PMs frame strategy, product growth, and decision-making in ways that leadership can absorb quickly.
Frequently Asked Questions From Product Managers
What if engagement is up but revenue is down
Treat this as a segmentation problem before you treat it as a strategy contradiction.
The first question is whether the same users are driving both trends. If engagement is rising in low-intent or free-heavy segments while revenue falls in your monetizable segment, the product may be broadening activity without strengthening value capture. If engagement is rising among your best customers but revenue is down, pricing, packaging, or conversion mechanics may be the issue.
Don't ask, “Which metric should win?” Ask, “What user behavior changed, for whom, and what does the business want more of?”
How do you measure a 0-to-1 product with no users yet
Use evidence of problem validation and value comprehension before you use scaled product metrics.
For a true 0-to-1 product, early signals often come from user reactions, workflow completion in prototypes, willingness to adopt the new behavior, and whether target users pull you into a next conversation. You're not measuring growth yet. You're measuring whether the product deserves growth.
That's especially true in AI products. Teams often mistake curiosity for demand. If people try it once because it's novel but don't trust it for meaningful work, you don't have a product signal yet.
My North Star is too slow-moving for a team to use weekly
That's normal. Organizations often need a stack, not a single number.
Keep the North Star for strategic alignment, then give the team a more sensitive proxy that predicts movement toward it. The proxy should be close enough to value that it can't drift into vanity. Many teams become sloppy in this area. They start with a good strategic metric, then operate the team on a lightweight activity count because it moves faster.
The right move is to pair them. Strategic metric above. Team-level operating metric below. One keeps direction. The other supports pace.
How often should we change the metric that matters
More often than many teams are comfortable with.
A common challenge is choosing a metric when the business has multiple bottlenecks. Good guidance on the one metric that matters says the metric should follow the current bottleneck and often be temporary, not permanent. Once the growth constraint moves, the metric should be retired so the team doesn't over-optimize a solved problem, as explained in this essay on when to change the one metric that matters.
That's one of the biggest differences between competent PMs and senior leaders. Competent PMs pick a metric. Senior leaders know when to change it.
How do I manage up using metrics without looking like I'm cherry-picking
Use a three-part structure in reviews:
- State the business question clearly
- Show the primary metric and one counter-metric
- Recommend the decision
The counter-metric is what keeps you honest. If you present activation, include a quality or retention lens. If you present monetization, include user behavior context. Executives trust PMs who surface trade-offs without being asked.
If leadership has to pull the caveats out of you, you look defensive. If you bring the caveats yourself, you look senior.
The PMs who become Directors and VPs usually build that habit early. They don't just bring numbers upward. They bring judgment.
If you want more practical coaching on metrics, product growth, and the judgment skills that separate solid PMs from promotable leaders, explore Aakash Gupta. His writing, podcast, and coaching resources are built for PMs who want to get better at real operating decisions, not just frameworks.