If you're asking what does a leading indicator do, the practical answer is simple. It gives a product team time to act before the headline number gets worse.
Most PMs spend too much time explaining bad outcomes after they show up in revenue, churn, or retention reports. By then, the damage is already visible to leadership, sales, support, and finance. The stronger PMs I've worked with do something different. They watch for earlier signals in behavior, adoption, and market conditions, then they intervene while there's still an opportunity to influence the outcome.
That's the difference between managing a dashboard and managing a business. A lagging metric tells you what happened. A leading indicator tells you what's likely to happen next, if you do nothing.
The Two PMs Who Saw The Future
Two PMs can look at the same business and behave completely differently.
The first PM walks into the weekly review and sees MRR down. She starts digging through last month's dashboards, asks analytics for a breakdown, and tries to reconstruct what went wrong. She's working hard, but she's already late. She's driving by staring into the mirror.

The second PM sees the same MRR drop and isn't surprised. She had already noticed a decline in an activation behavior that usually shows up earlier in the customer journey. She shipped an onboarding fix, aligned lifecycle messaging with marketing, and warned leadership that the revenue line might soften before recovering. She looked calmer because she had signal earlier.
That's what a leading indicator does. It doesn't predict the future with certainty, but it gives you a directional edge while there's still time to change the outcome.
Economic leaders have used this logic for years. The Conference Board Leading Economic Index, which combines 10 economic series, helps organizations anticipate turning points in business cycles months in advance. For PMs, tools like the Purchasing Managers' Index can help teams adjust roadmaps 2 to 3 months ahead of market shifts, according to the Richmond Fed's explanation of leading indicators.
Why this matters in product careers
A PM who can spot early movement earns trust differently.
They don't just report outcomes. They create options. That's the same muscle behind strong product strategy, sharper planning, and better executive communication. You can see that mindset in operator-focused breakdowns like this Stripe product analysis, where the important question isn't just what grew, but what behavior made growth more likely.
A useful leading indicator changes the conversation from “why did this happen?” to “what should we do before this lands in revenue?”
Leading vs Lagging Indicators The Definitive Guide
Every product team tracks metrics. Fewer teams track the right metric at the right point in time.
A lagging indicator measures an outcome after it has happened. Revenue, churn, renewal rate, and support backlog fit here. They matter, but they are hard to influence directly in the moment because they are the result of many earlier decisions.
A leading indicator measures an input or behavior that tends to show up before the result. It's closer to the work. It gives the team a place to intervene.
The cleanest way to think about it is a car dashboard. Speed tells you where you are now. Fuel and engine temperature tell you whether a problem is forming. In product, lagging metrics are the speed reading after the fact. Leading indicators are the signals that let you correct course.
According to Amplitude's guide to leading and lagging indicators, leading indicators are actionable input metrics that predict future outcomes, while lagging indicators measure past results. The same piece gives a simple business example: a software company can track user downloads as a leading signal for revenue, while a sales team can track appointments to forecast pipeline conversion.
Leading vs. Lagging Indicators for Product Managers
| Metric Type | Leading Indicator (Input/Predictive) | Lagging Indicator (Output/Result) |
|---|---|---|
| User acquisition | Trial starts from qualified traffic | New paying customers |
| Onboarding | Users completing a key setup step | Activation rate |
| Engagement | Teams using a collaboration workflow weekly | Account retention |
| Monetization | Accounts reaching usage threshold before paywall | Expansion revenue |
| Enterprise product | Integrations enabled per account | Renewal rate |
| AI product | Time to first successful output | Developer retention |
What works and what doesn't
What works is a metric the team can influence this sprint.
What doesn't work is calling revenue a leading indicator just because leadership wants to see it every Monday. Revenue is vital, but it's usually too far downstream for daily product decision-making. If you want a PM-friendly breakdown of the downstream side, this explanation of lagging indicators is useful context.
A good leading indicator usually has three traits:
- It happens earlier: The signal appears before the business outcome.
- The team can move it: Product, design, engineering, or growth can influence it directly.
- It has a plausible mechanism: You can explain why the behavior should lead to retention, conversion, or expansion.
The mistake I see most often is teams picking a metric because it's available, not because it's predictive.
The real trade-off
Leading indicators are more useful than lagging ones for operating a product day to day. They're also easier to get wrong.
A lagging metric is usually obvious. A leading indicator requires judgment. You have to define it, instrument it, and test whether it predicts anything. That's where most PMs either level up or drift into vanity analytics.
Find Your North Star Examples for Every PM
The right leading indicator depends on the product, the customer, and the business model. There isn't one universal answer. A growth PM, a B2B platform PM, and an AI PM should not watch the same early signals.
Growth PMs
For a consumer or PLG product, the best leading indicators usually track a behavior that spreads value or locks in habit.
At a company like Dropbox, I'd look closely at actions that reflect collaboration, not just signups. A raw signup number is noisy. Sharing a file, inviting a teammate, or returning to use the product for a real workflow is more meaningful because it suggests the product is becoming embedded in work.
Netflix-style products face a similar problem. Starts matter less than habit formation. A stronger leading indicator might be whether a new user returns quickly and consumes enough content to establish a routine. The exact metric varies, but the principle doesn't.
B2B SaaS PMs
B2B products usually get stronger predictions from depth-of-adoption metrics.
If you're at a Salesforce-style company, “account created” tells you almost nothing. “Multiple integrations enabled,” “admin configured core workflow,” or “second team onboarded” are better candidates because they suggest switching costs and operational dependency are rising.
Here's a simple lens I use in enterprise products:
- Shallow adoption: Logins, page views, trial starts
- Meaningful adoption: Workflow completion, integrations, role-based usage
- Sticky adoption: Cross-functional usage, admin setup, recurring business process dependence
The closer you get to sticky adoption, the more likely you're watching a real leading indicator instead of a vanity one.
A useful brainstorming aid is the north star metric framework. Not because every product needs one magical number, but because it forces teams to ask what user behavior reflects delivered value.
AI PMs
AI products need especially careful leading indicators because novelty can mask weak retention.
For an API business like OpenAI, a strong candidate is time to first successful API call. That's often more meaningful than docs page views or account registrations because it measures whether the developer crossed from curiosity into actual implementation.
For AI copilots and assistants, I'd also examine signals like repeat successful sessions, acceptance of generated outputs, or movement from exploratory usage into production usage. These aren't guaranteed predictors, but they're better than counting prompts alone.
In AI products, the most dangerous vanity metric is activity without proof of value. Usage can rise because the feature is interesting, not because it's useful.
A quick selection test
If your team is debating candidate indicators, ask four questions in sprint planning:
- Does this behavior happen before the outcome we care about?
- Can our team influence it in the next release cycle?
- Would a skeptic believe the causal story?
- If this metric rises, what would we do differently next week?
If the room can't answer the fourth question, it's probably not operationally useful.
How to Validate Your Leading Indicators
Most teams don't fail because they lack dashboards. They fail because they promote a metric into strategy without proving that it predicts anything useful.
That's the uncomfortable part of this topic. A metric doesn't become a leading indicator because a PM labels it one. It becomes one after you test whether movement in that metric reliably comes before, and ideally contributes to, movement in the outcome.
A Mercury write-up on leading versus lagging indicators cites a 2023 Amplitude study showing that only 28% of so-called leading metrics had statistically validated causality. The same source notes that Facebook's well-known “7 friends in 10 days” metric mattered because it was rigorously validated, a step many organizations skip.
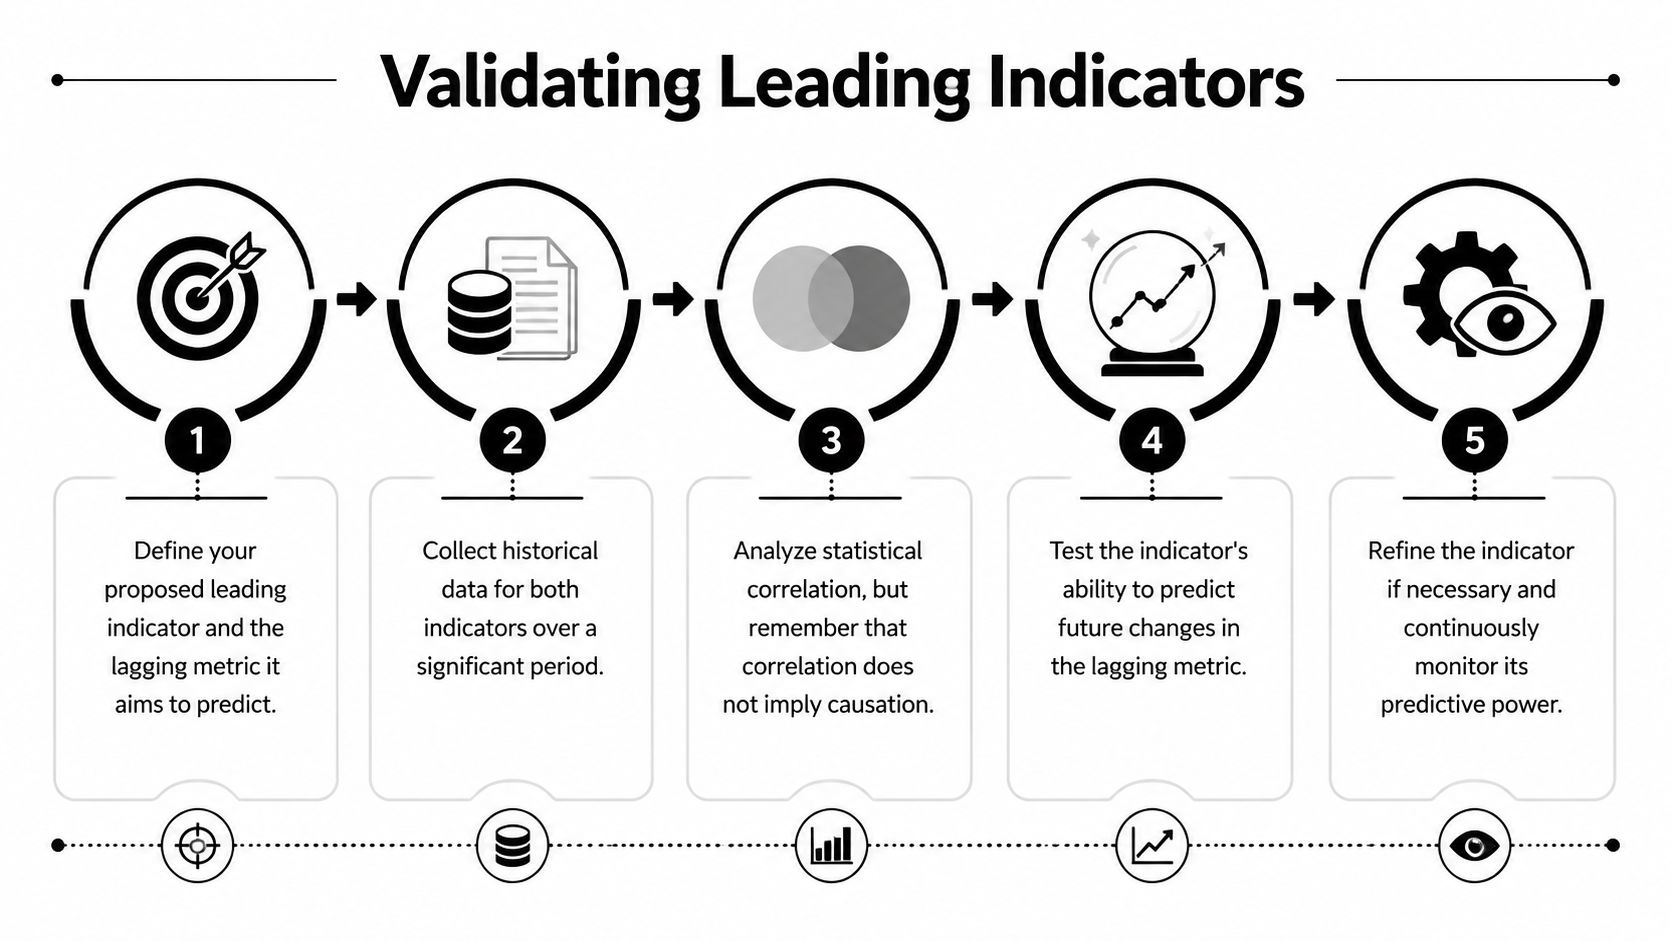
The five-step validation framework
1. Define the pair
Start with one proposed leading indicator and one lagging outcome.
Example: “Users who complete workspace setup in the first session are more likely to retain.” Keep it tight. Don't test five outcomes at once.
2. Check historical sequencing
Pull historical data and verify order. The candidate signal has to appear before the outcome. If the lagging metric moves first, you don't have a leading indicator. You have a coincidence or a trailing symptom.
Cohort analysis is the easiest place to start. Compare users who performed the early behavior against those who didn't. Then look at later retention, conversion, or expansion.
3. Measure association, then challenge it
Many teams stop at this point. Don't.
Regression can help you understand whether the relationship still holds when you account for confounders like acquisition source, company size, or user role. If you want a hands-on way to unlock predictive insights with Excel, that resource is practical for PMs who need to test ideas without waiting on a data scientist.
You can also go deeper with methods discussed in product analytics circles, including regression-based validation and causal testing. For PMs who want a more product-oriented primer, this guide to regression analysis is a useful complement.
Practical rule: Correlation is a filter, not a conclusion.
4. Run an intervention test
If the metric is leading, then deliberately moving it should change the lagging outcome.
That means A/B testing onboarding, nudges, pricing exposure, education, or workflow design to increase the candidate behavior. If the behavior rises and the outcome doesn't, the metric may be descriptive rather than predictive.
5. Revalidate over time
Indicators decay. User behavior changes, markets shift, and growth loops saturate. A metric that predicted retention last year can become irrelevant after a packaging change or a move upmarket.
What PMs should bring to sprint planning
Bring a validation brief, not just a dashboard screenshot.
Use a one-page template:
- Hypothesis: Which early behavior should predict which business outcome
- Population: Who you're measuring
- Time window: When the signal occurs and when the outcome is assessed
- Confounders: What else could explain the relationship
- Next action: What experiment would try to move the signal
That's the difference between “we think this matters” and “we have enough evidence to invest.”
Building Your Predictive Dashboard
A leading indicator is only useful if the team sees it often enough to act on it. Buried metrics don't shape decisions. Visible metrics do.
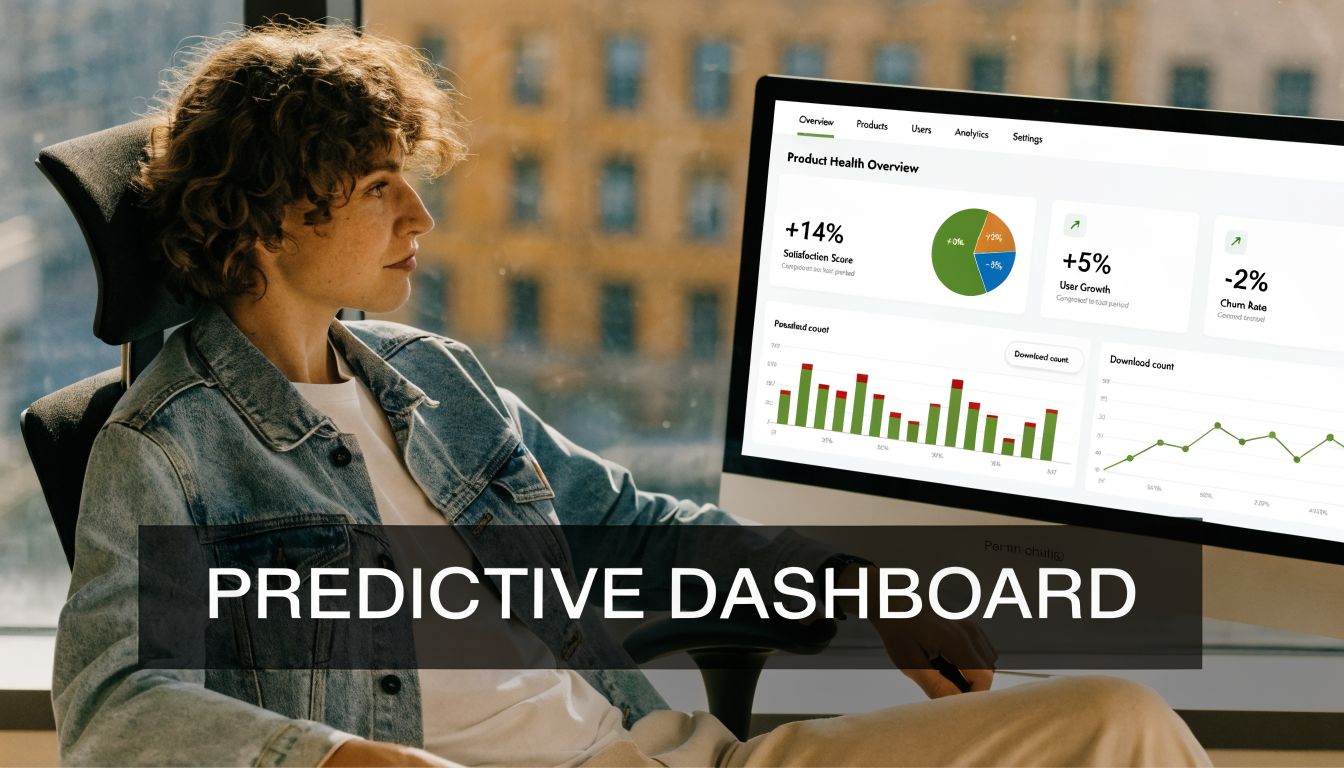
The dashboard I want in front of a PM team isn't a giant wall of KPIs. It's a compact operating view that links early signal to business result.
The dashboard structure I recommend
Core leading indicator
This is the one behavior you believe gives the earliest trustworthy signal. Put it at the top. Show trend and target.
Examples:
- PLG SaaS: accounts reaching first collaborative action
- Marketplace: first successful transaction after signup
- AI tool: first successful task completed with accepted output
Driver metrics
These are the components that move the core indicator. If setup completion drops, what caused it. Traffic quality, onboarding step completion, integration success, invite acceptance, or prompt success rate are all possible drivers.
Tools like Amplitude and Mixpanel help because they make funnel and cohort breakdowns easier to inspect than static spreadsheets.
Target lagging indicator
Place the lagging metric on the same screen so the team remembers what the signal is supposed to predict. Retention, expansion, qualified pipeline, or paid conversion belong here.
Guardrails
Every strong PM team adds guardrails. If you drive activation by annoying users, support volume can spike. If you push AI usage too aggressively, output quality complaints may rise.
For ecommerce teams, the same principle shows up in merchandising and conversion work. If you operate in that world, this overview of predictive analytics for Shopify stores is a good example of connecting early customer signals to commercial decisions.
Visualization choices that actually help
Use chart types that reveal action, not decoration:
- Line chart: Best for tracking the core indicator over time
- Funnel chart: Best for onboarding and setup progression
- Cohort table: Best for validating whether early behavior links to retention
- Scatter plot: Best for exploring relationship strength between candidate and outcome
- Annotated trend chart: Best for showing when an experiment changed the signal
A practical walkthrough helps teams avoid overbuilding. This video is a good companion for thinking about dashboard setup and interpretation.
Keep it operational
A dashboard should answer three questions fast:
- Did the early signal move?
- Why did it move?
- What should the team do this week?
If your dashboard can't do that, it's a reporting artifact, not a product operating system. For teams refining broader KPI sets, this metrics guide for product managers is a useful reference.
Advanced Plays for Senior and AI PMs
Senior PMs usually stop arguing about whether leading indicators matter. Their harder problem is choosing better signals than everyone else.
That means two things. First, borrowing methods from adjacent fields when they help. Second, learning to detect false leads before the team overinvests.

Borrow from market analysis carefully
One advanced move is to apply momentum logic to product behavior.
The classic example from financial markets is the Relative Strength Index, or RSI, which is used as a leading indicator for momentum shifts. I wouldn't blindly import trading logic into product work, but the mental model is useful. You can examine whether signup velocity, feature adoption, or usage intensity is reaching a short-term peak that may cool off, especially when growth quality isn't keeping pace.
In practice, this means looking for mismatches. Weekly signups may rise while retained active users flatten. Prompt volume may surge while accepted outputs stagnate. That divergence is often more useful than the headline growth number.
Watch for anti-leading indicators
Not every early-moving metric predicts good outcomes. Some predict trouble.
A BMC write-up on leading versus lagging indicators says a 2025 survey found that 35% of PMs at unicorns chased indicators like “seats added,” which correlated with 22% higher churn. The same source describes newer approaches such as indicator decay scoring and AI-generated dynamic leading indicators from user telemetry, with reported 18% improvement in MRR prediction accuracy.
That should sound familiar to anyone who has worked in enterprise SaaS. A burst of added seats can reflect healthy expansion. It can also reflect chaotic rollout before a rollback, forced procurement behavior, or broad license assignment without adoption. The metric moves early, but toward the wrong story.
Some metrics are early signals of value. Others are early signals of risk. Senior PMs learn the difference.
What AI changes
AI gives PMs a new way to generate hypotheses from raw telemetry instead of relying only on intuition.
You can ask models to cluster user paths, surface unusual pre-churn behavior, or propose candidate behaviors that separate retained users from non-retained ones. That doesn't replace validation. It speeds up discovery.
For AI PMs and product leaders, prompt discipline matters here. If your team is using models to mine event streams, summarize cohorts, or generate candidate signals, a set of AI prompt templates for product managers can save time and make the work more repeatable.
A senior-level operating model
I like a quarterly review with three lenses:
- Signal strength: Is the indicator still predictive?
- Actionability: Can teams still move it through product changes?
- Decay risk: Has the metric become stale because the product or market changed?
That review is how you avoid worshipping last year's metric. It's also how you build a product organization that behaves more like a disciplined investor than a reactive committee.
From Reactive to Predictive Product Management
So what does a leading indicator do?
It gives a PM early warning and decision power. It helps you act before churn, revenue loss, or stalled retention become visible in the numbers everyone watches. More effectively, it changes your role. You stop being the person who explains surprises and become the person who reduces them.
The strongest teams don't just pick a metric and hope. They define a signal, validate it, put it in front of the team, and keep retesting whether it still predicts the outcome that matters. That system is what separates operational discipline from metric theater.
If you're an aspiring PM, this is one of the fastest ways to sound more senior. If you already lead a team, it's one of the clearest ways to improve planning quality. Start small. Pick one candidate indicator this week. Tie it to one lagging metric. Then test whether it deserves the label.
If you want more practical product systems like this, Aakash Gupta publishes operator-focused resources for PMs working on growth, analytics, hiring, and career progression.
